


 FxWirePro: EUR/NZD up trend gains momentum but hurdles ahead
  JPY Pairs Action Bias: EURJPY Leads as Bullish Standout Amid Mixed Momentum
  AUDJPY Weakness Deepens: Sell Rallies Toward 112 as Aussie Dollar Falters
  FxWirePro: EUR/AUD outlook weaker on renewed downside pressure
  FxWirePro- Woodies pivot (Major)
  NZDJPY Pullback: Sell Rallies Toward 93.30 as Yen Weakness Eases
  FxWirePro: NZD/USD edges lower, remains on back foot
  FxWirePro: GBP/NZD maintains bersish bias with focus on 2.2900 level
  FxWirePro : USD/JPY holds relatively bid on 163 ahead Of FOMC,BoJ meetings
  Major Pairs Action Bias: USDCAD and USDCHF Stand Out as Extremely Bullish While GBPUSD and NZDUSD Turn Extremely Bearish
  Crypto Action Bias: ETHUSD Stands Out as the Bullish Pair to Watch
  FxWirePro: USD/ZAR retreats but trend is still bullish
  FxWirePro: GBP/AUD downside pressure builds, key support level in focus
  FxWirePro: EUR/ AUD gains some ground , but remains on bearish path
  Major Forex Pairs Action Bias: GBPUSD and AUDUSD Turn Extremely Bearish
  FxWirePro- Major Pair levels and bias summary


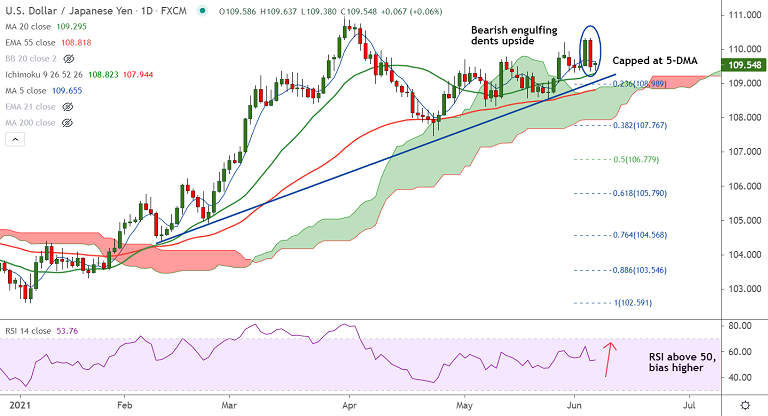
USD/JPY chart - Trading View
Spot Analysis:
USD/JPY was trading largely unchanged on the day at 109.46 at around 06:30 GMT.
Previous Week's High/ Low: 110.32/ 109.33
Fundamental Overview:
The disappointing US labour market data sent bond yields lower on Friday with 10Y US Treasuries declining some 6bp.
US Nonfarm Payrolls that were too soft for markets to price in a change in Fed policy. Fed's patient stance to stay at the FOMC meeting Wednesday next week.
Focus now on the CPI release on Thursday, where consensus looks for a further rise in core inflation to 3.4% y/y.
Technical Analysis:
- Bearish engulfing in the previous week's candle dents upside in the pair.
- Price action has slipped below 200H MA, raising scope for further weakness.
- 5-DMA caps upside at 109.65, GMMA on the intraday charts has turned bearish.
Major Support and Resistance Levels:
Support - 109.29 (20-DMA), 109.05 (Trendline), 108.86 (200W MA)
Resistance - 109.60 (200H MA), 109.65 (5-DMA), 110
Summary: USD/JPY is likely to see minor pullbacks, Consolidation likely for the pair ahead of next week's FOMC meet. Major weakness only below 200W MA.


