


 FxWirePro: EUR/AUD regains upwards momentum but unable to hold above 50%fib level
  FxWirePro- Major Crypto levels and bias summary
  FxWirePro: NZD/USD firms as Kiwi gains on strong ANZ business outlook data
  FxWirePro: USD/ CNY remains soft ahead of Fed decision
  FxWirePro: GBP/AUD gains some upside momentum but still bearish
  FxWirePro: AUD/USD dips below lower range, bearish bias increases
  FxWirePro: GBP/AUD gains above 1.9200 level , upside pressure builds
  FxWirePro: USD/JPY eases ahead of Fed decision , Intervention risks linger
  FxWirePro: USD/CAD runs out of steam but maintains bullish outlook
  FxWirePro: GBP/NZD maintains bersish bias with focus on 2.2900 level
  FxWirePro: USD/ CNY hits one-month low,scope for futher downside
  FxWirePro- Major Pair levels and bias summary
  FxWirePro: NZD/USD neutral in the near-term, scope for downward resumption
  FxWirePro- Woodies pivot (Major)
  FxWirePro: AUD/USD falls after softer-than-expected Australian Q2 CPI
  JPY Action Bias: EURJPY and CADJPY Emerge as Extremely Bullish Pairs to Watch
  FxWirePro: GBP/USD edges lower ahead of Fed policy verdict


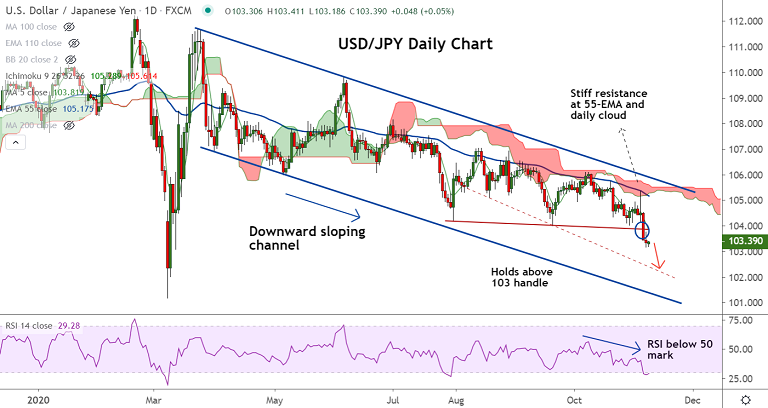
USD/JPY chart - Trading View
USD/JPY was trading largely unchanged at 103.36 at around 04:10 GMT after closing 0.10% lower in the previous session.
The pair has held above 103 support and further weakness only on break below. That said, technical analysis for now does not indicate any respite from the bear grip.
Major and minor trend as evidenced by the GMMA indicator are strongly bearish. Volatility is high and RSI well below the 50 mark.
On the data front, US October non-farm payrolls beat expectations, came in at 638k, better than expectations for 580k, and after the upwardly-revised 672k in the prior month.
The participation rate printed at 61.7%, also better than expectations, for 61.5%, and compared to a prior reading at 61.4%.
Also, U.S. wholesale inventories were higher than initially estimated in September. The Commerce Department said wholesale inventories gained 0.4% in September, instead of dipping 0.1% as estimated last month. Stocks at wholesalers increased 0.5% in August.
US election results continue to sway markets with rising volatility. Inconclusiveness continues with regards to legal challenges.
Technical bias remains bearish. However, oversold oscillators may cause some upside. Pullbacks likely to be shallow until accompanied by shift in indicators.
5-DMA is immediate resistance at 103.81 ahead of 21-EMA at 104.52. Decisive break above 55-EMA required for change in near-term trend.
On the downside, break below 103 handle will see dip till 102.40 (trendline). Next major support below lies at 101.30 (channel base).


