
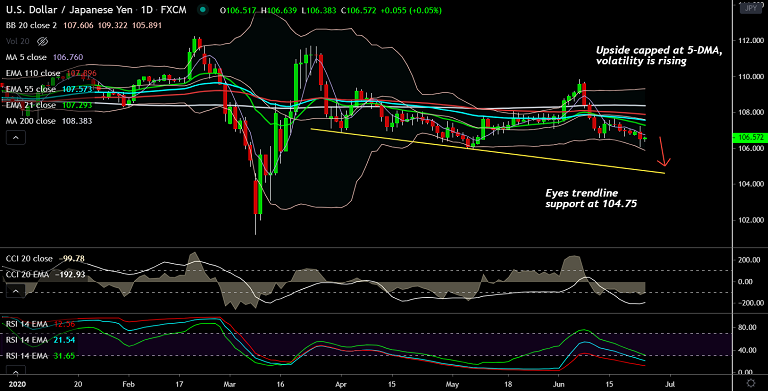
USD/JPY chart - Trading View
Technical Analysis: Bias Bearish
GMMA Indicator
- Minor trend is strongly bearish, short-term moving averages are sharply lower and widening
- Major trend is turning bearish with constriction and downward shift in major moving averages
Ichimoku Analysis
- Price action has slipped below daily cloud
- Bearish Tenkan Sen crossover on Kijun sen adds to the bearish bias
- Upside remains capped at Tenkan Sen
Oscillators
- RSI is well below 50 and biased lower
- Stochastics show strong bearish momentum, but remain at oversold levels raising scope for minor pullbacks
Bollinger Bands
- Bollinger bands are widening on the daily and weekly charts
- Volatility is rising and could see major price movements
Major Support Levels: 105.89 (Lower BB), 105 (Psychological mark), 104.75 (Trendline support)
Major Resistance Levels: 106.75 (5-DMA), 107.29 (21-EMA), 107.89 (110-EMA)
Summary: USD/JPY is consolidating previous session's slump. Recovery lacks traction and technical indicators suggest further downside. The pair is set to close in the red for the 3rd straight week. Next bear target 104.75 (major trendline support).


