


 FxWirePro: GBP/USD downtrend loses steam but outlook still bearish
  FxWirePro: EUR/NZD firms after ECB holds rates steady at 2.25%
  FxWirePro: USD/CAD edges lower but bullish outlook persists
  Major Pairs Action Bias: USDCHF Emerges Extremely Bullish as EURUSD and GBPUSD Turn Deeply Bearish
  AUDJPY Extends Four-Day Rally on Yen Weakness: Bullish Dip-Buy Eyes 117-118
  FxWirePro: USD/CAD positions for another climb, eyes 1.4150 level
  FxWirePro:USD/JPY hovers near a four-decade low
  FxWirePro- Woodies pivot (Major)
  FxWirePro- Major Pair levels and bias summary
  FxWirePro: EUR/AUD neutral in the near term, scope for downward resumption
  FxWirePro: GBP/AUD under pressure as pound continues to weaken
  FxWirePro: AUD/USD uptrend loses steam, remains on bearish path
  FxWirePro- Major Crypto levels and bias summary
  FxWirePro: GBP/AUD bears maintain upper hand
  FxWirePro: GBP/USD slips as middle east tensions and oil surge pressure pound
  BTC, ETH, SOL, XRP, and BNB: Major Crypto Pairs Stay Neutral
  NZDJPY Bullish Dip-Buy Setup: 93.60 Support Unlocks Path to 97


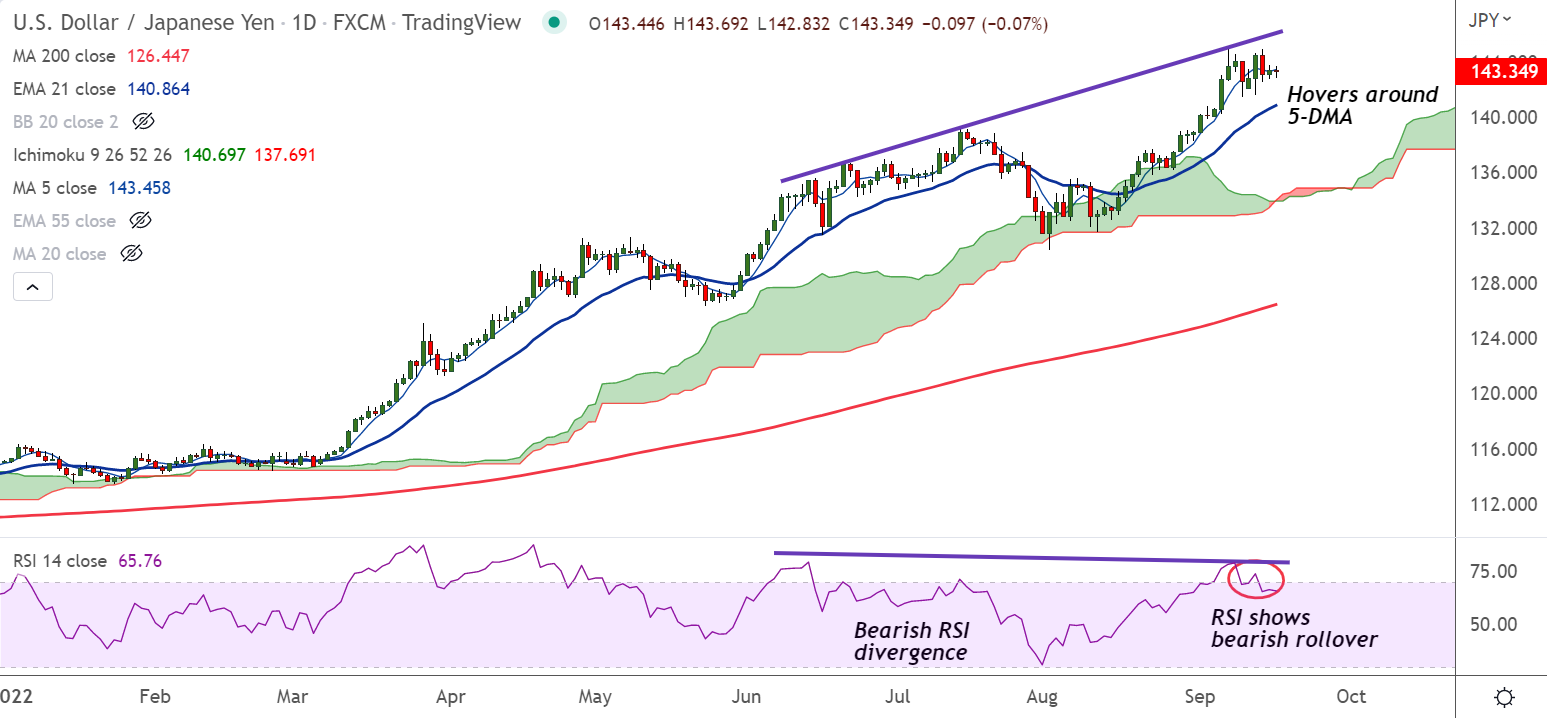
Chart - Courtesy Trading View
Spot Analysis:
USD/JPY was trading largely unchanged at 143.44 at around 07:45 GMT, outlook remains bearish.
Previous Week's High/ Low: 144.99/ 140.09
Previous Session's High/ Low: 143.80/ 142.79
Fundamental Overview:
Stronger US CPI report released on Tuesday lifted bets for a more aggressive policy tightening by the Fed, which continues to underpin the greenback.
Caution prevails ahead of the upcoming FOMC meeting on September 20-21, for which the markets are pricing in the possibility of a full 100 bps rate hike.
Bank of Japan, on the other side, has been lagging behind other major central banks in the process of policy normalization.
The resultant Fed-BoJ policy divergence is another factor lending some support to the USD/JPY pair.
Technical Analysis:
- USD/JPY extends range trade around 5-DMA, holds above 200H MA support
- MACD is on verge of bearish crossover on signal line, ADX supports weakness
- Bearish RSI divergence adds to the downside bias
- GMMA indicator shows major and minor trend are neutral on the intraday charts
Major Support and Resistance Levels:
Support - 143.22 (200H MA), 140.86 (21-EMA)
Resistance - 145.86 (Trendline), 146.08 (Upper BB)
Summary: USD/JPY pivotal at 200H MA, break below will drag the pair lower. Major trend is bullish, trend reversal only below 21-EMA.


