


 FxWirePro: EUR/NZD downside pressure builds, key support level in focus
  FxWirePro: AUD/USD gains on Iran-US truce hopes, risk rally
  GBPJPY Slips After Sterling Weakness, Bears Eye 216
  FxWirePro: USD/CAD gaining momentum for a move towards 1.4200 level
  FxWirePro- Major Crypto levels and bias summary
  FxWirePro: AUD/USD dips after RBA Governor speech
  FxWirePro :USD/JPY eases slightly, remains on bullish path
  NZDJPY Pullback: Sell Rallies Toward 93.30 as Yen Weakness Eases
  FxWirePro: USD/ZAR uptrend loses steam, remains on bullish path
  AUDJPY Action Bias: Bullish Dip-Buy Setup Despite Flat Neutral Bias
  FxWirePro: GBP/NZD downside pressure builds, key support levels in focus
  JPY Action Bias: USDJPY Emerges as the Clear Bullish Pair to Watch Amid Mixed Crosses
  Major Pairs Action Bias: USDCAD and USDCHF Stand Out as Extremely Bullish While GBPUSD and NZDUSD Turn Extremely Bearish
  FxWirePro- Woodies pivot (Major)
  FxWirePro: GBP/AUD under pressure as pound continues to weaken
  FxWirePro: GBP/AUD downside pressure builds, key support level in focus


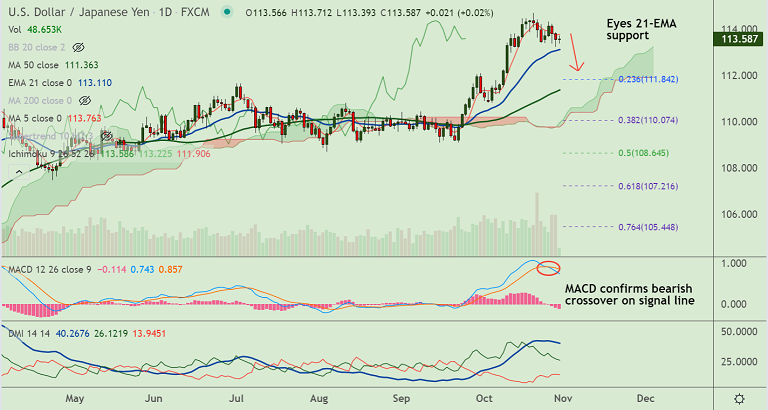
USD/JPY chart - Trading View
USD/JPY was trading largely muted on the day at 113.60 at around 05:50 GMT, with session high at 113.71 and low at 113.39.
The pair is consolidating previous session's weakness and remains rangebound below 5-DMA.
Dismal US GDP data which showed the slowest pace in more than a year kept the greenback under pressure.
Data released overnight showed gross domestic product grew at only a 2% annualized rate in the quarter ended in September, missing forecasts at a 2.7% rate.
Further, consumers' inflation expectations over the next 12 months jumped to a 13-year high.
The dollar index (DXY) was headed for a third straight weekly decline, while benchmark 10-year U.S. Treasury yields were set for their biggest weekly decline in three months.
Market participants now await the Fed policy meeting next week. Investors focus on how the Federal Reserve responds to higher inflation and concerns over tepid economic growth.
Major Support Levels:
S1: 113.24 (20-DMA)
S2: 113.11 (21-EMA)
S3: 113
Major Resistance Levels:
R1: 113.77 (5-DMA)
R2: 113.93 (200H MA)
R3: 114
Summary: USD/JPY was trading with a bearish technical bias. 21-EMA offers strong support at 113.11. Break below will see more downside. Retrace above 200H MA to see upside resumption.


