


 FxWirePro: NZD/USD under pressure amid US-Iran deterioration
  FxWirePro: AUD/USD firms slightly, but downward resumption looks likely
  AUDJPY Rejected at 113: Triple EMA Bearish Stack and Surging ADX Point to 110.50
  FxWirePro: AUD/USD eases as middle east peace progress ebbs
  FxWirePro USD/JPY consolidates above 160.00 level despite fresh currency intervention threats
  USD/CHF Retreats to Key Trend-Line Wall; Buy-Above-0.8000 Strategy Targets Sharp Rally to 0.8150
  FxWirePro: USD/CNY holds flat amid concerns over Middle East risks and upcoming U.S. CPI
  FxWirePro: GBP/AUD eases slightly but trend is still bullish
  Gold Stalls Below $4150 as Hot CPI Fuels Dollar Strength and Safe-Haven Bid Fades
  FxWirePro: USD/CAD steadies around 1.3920 level , retains bid tonne
  FxWirePro: GBP/AUD maintains bullish bias with focus on 1.9100
  FxWirePro- Major Crypto levels and bias summary
  FxWirePro- Woodies pivot (Major)
  FxWirePro- Woodies pivot (Major)
  Sterling Surge: GBP/JPY Smashes Above 214 With Triple EMA Blessing; Bulls Eye 217
  FxWirePro- Major European Indices


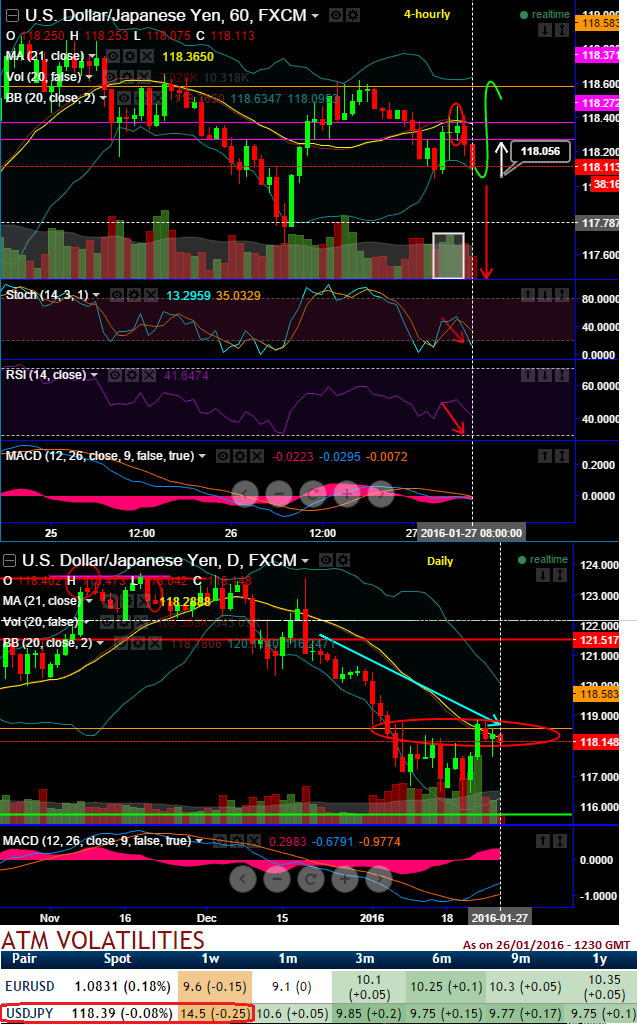
It's been keenly observed that USD/JPY restrained within range of 118.587 to 118.067.
In this range bounded process the pair has broken the important supports at 118.371 and 118.272, could not sustain 21DMA (mid-line of BB).
On daily charts, we could foresee all signs of attempts to retesting supports at 115.750 regions if at all it has to show some bounces but on a long-term perspective, the non-directional trend is now slightly sensing weakness that has lasted for almost 1 year that remained in the range of 115.750 - 125.856.
It has broken below a strong support at 118.587 decisively with shooting star pattern and massive volumes to build new bearish atmosphere (see grey shaded areas). In worst case scenario if it breaches these levels then 121.517 is the next certain juncture to pull back southwards.
We are bearish on this pair in long run, speculators should not see upswings beyond 118.854.
While USD/JPY's uptrend is contracted into narrow range, other oscillating indicators shown a clear convergence to the previous puzzling swings in sideway trend; for now bearish sensation is piling up although interim upswings cannot be disregarded.
BB (100, 2)
RSI (14) above 25.
Stochastic: %K crossover above oversold region.
The HY IVs objective
The strategy requires and suits for high volatile market, As per the OTC observation USDJPY is likely to perceive 14% implied vols for 1W expiries which is highest among G7 space, we need to see the lower or upper bands spiked and bands far apart.
If bands tight together up to 50 pips no trades, as my entry comes after the price has broken the red green lines with rsi histogram turning the correct colour also.
Scenario: When price goes down, spikes lower bands, the lines are also slumping down, now wait for price to close the downward sloping blue lines and leading indicators to diverge these price dips and wait for Stochs and RSI lines turns spiking up.
Even if the price closes the blue BB lines but RSI is still below oversold territory, prefer not to touch the price, leading oscillators need to approve for fresh longs.
Look how many times in the last few days this stops losing entry trades after the lower 100 bands are spiked. It's a great filter to this system.
Eye on binary calls when above conditions satisfy after keeping 20 points stop loss for 40 TPs, thereby, one can have ideal risk reward ratio at 2:1 when you get double the risk, immediately should square off the position.
Most likely and alternative scenarios: Immediate strong resistance is seen at 118.587 but more interest is observed to remain below support at 118.056 or below.

- News

- Economy

- Central Banks
- Investing
- Research
- Roundups
- Digital Currency
- Insights
- Technical Analysis
- Technology
- Business
- Law
- Health
- Nature
- Fintech
- Science
- Topic
- Opinions
- ©Econometrics LLC . All Rights Reserved.
FxWirePro: USD/JPY scalping via binary options capitalizing on HY IVs
Wednesday, January 27, 2016 8:34 AM UTC
Editor's Picks


- Market Data
Most Popular


