
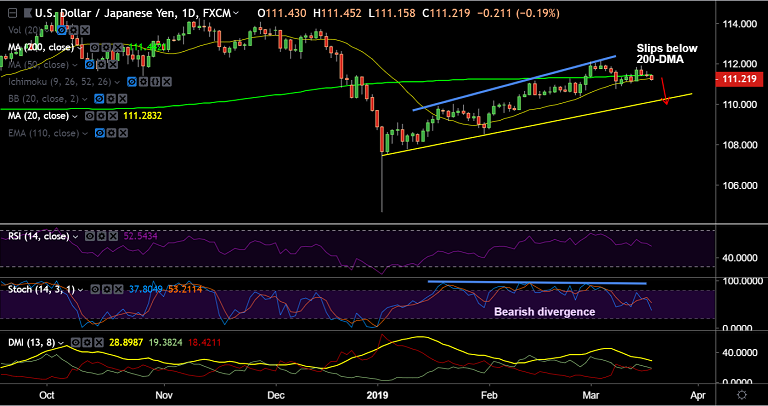
USD/JPY chart - Trading View
- USD/JPY dragged lower on broad-based USD selling, trades 0.18% lower on the day at 111.22 at 0345 GMT.
- The major has slipped below 200-DMA and is hovering above 21-EMA support at 111.16. Break below will see further weakness.
- Futures market continues to price out the possibility of any further Fed rate hikes in this cycle, but there is an increasing chance now up to 30% of a cut by December.
- Technical studies on the daily charts have turned slightly bearish. Stochs and RSI have turned south.
- The pair also has added downside pressure from a bearish divergence on Stochastics on the daily charts.
- Focus now on FOMC meeting for further impetus.
Support levels - 111.16 (21-EMA), 111.03 (110-EMA), 110.90 (55-EMA), 110.20 (trendline)
Resistance levels - 111.39 (5-DMA), 111.45 (200-DMA), 112, 112.21 (76.4% Fib)
Recommendation: Watch out for break below 21-EMA to go short.
For details on FxWirePro's Currency Strength Index, visit http://www.fxwirepro.com/currencyindex.


