


 FxWirePro: AUD/USD dips below lower range, bearish bias increases
  China's Refining Industry Faces Major Shakeup Amid Challenges
  Goldman Predicts 50% Odds of 10% U.S. Tariff on Copper by Q1 Close
  Gold Prices Slide as Rate Cut Prospects Diminish; Copper Gains on China Stimulus Hopes
  FxWirePro- Major Crypto levels and bias summary
  AUD/JPY Slips Below 112 as BOJ Intervention Sparks Bearish Momentum: Sell the Rallies
  FxWirePro: NZD/USD firms as Kiwi gains on strong ANZ business outlook data
  European Stocks Rally on Chinese Growth and Mining Merger Speculation
  2025 Market Outlook: Key January Events to Watch
  UBS Projects Mixed Market Outlook for 2025 Amid Trump Policy Uncertainty
  U.S. Treasury Yields Expected to Decline Amid Cooling Economic Pressures
  Trump’s "Shock and Awe" Agenda: Executive Orders from Day One
  U.S. Stocks vs. Bonds: Are Diverging Valuations Signaling a Shift?
  FxWirePro:EUR/NZD gains some upside momentum but still bearish
  Bank of America Posts Strong Q4 2024 Results, Shares Rise
  S&P 500 Relies on Tech for Growth in Q4 2024, Says Barclays


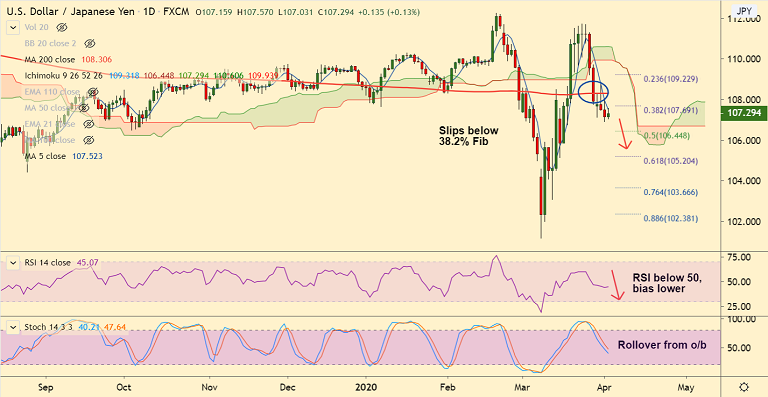
USD/JPY chart - Trading View
USD/JPY has slipped below 38.2% Fib, bias is strongly bearish.
The major was trading 0.12% higher on the day at 107.27 at around 09:30 GMT, after closing 0.31% lower in the previous session.
The ADP Non-Farm Payrolls and the ISM Manufacturing Purchasing Managers’ Index released on Wednesday beat expectations, but failed to benefit the US dollar.
Focus now on jobless claims report for the week ended March 21st. Goldman Sachs foresees 5.25 million claims.
Technical indicators are turning bearish. Stochs and RSI are now biased lower. MACD shows bearish crossover on signal line.
Upside was capped at 5-DMA at 107.52. Bearish 5-DMA crossover on 20-DMA adds to the bearish bias.
Immediate support lies at 106.44 (Kijun sen and 50% Fib). Further bearish momentum could see test of 61.8% Fib at 105.20.
Support levels - 107, 106.44 (Kijun sen and 50% Fib), 106, 105.20 (61.8% Fib)
Resistance levels - 107.52 (5-DMA), 108.30 (200-DMA), 108.75 (50-DMA)


