


 Buy the Dips on EUR/JPY: Bullish Structure Points to 188 Target Ahead of Fed
  FxWirePro: GBP/AUD drifts lower after BOE rate decision
  FxWirePro: GBP/NZD remains weak, eyes 38.2%fib support
  FxWirePro:EUR/NZD gains some upside momentum but still bearish
  FxWirePro: NZD/USD firms as Kiwi gains on strong ANZ business outlook data
  FxWirePro- Major Pair levels and bias summary
  FxWirePro: USD/ZAR firms ahead of Fed interest rate decision
  FxWirePro- Major Crypto levels and bias summary
  FxWirePro : GBP/NZD strongly bearish despite upside attempts
  FxWirePro- Major Pair levels and bias summary
  JPY Action Bias: EURJPY and CADJPY Emerge as Extremely Bullish Pairs to Watch
  FxWirePro: GBP/AUD gains above 1.9200 level , upside pressure builds
  FxWirePro: AUD/USD dips below lower range, bearish bias increases
  FxWirePro: USD/JPY edges higher as focus shifts to BOJ decision
  FxWirePro: USD/ CNY hits one-month low,scope for futher downside


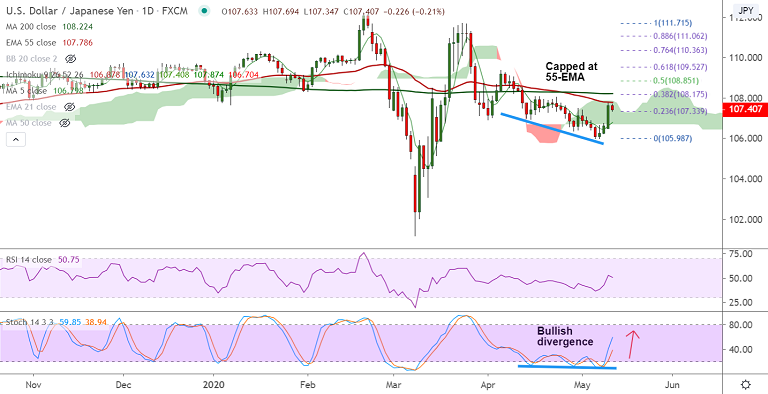
USD/JPY chart - Trading View
Fundamental Outlook:
USD/JPY under pressure amid risk-off, broad risk-aversion is knocking-down the pair.
BOJ Officials said that the central bank will keep buying ETFs as long as needed with eye on market moves.
The BoJ comments failed to have any impact on the yen market. USD/JPY extending declines from near 107.70 region.
Meanwhile, Bank of Japan's governor Kuroda has noted that the downside risks for the economic outlook are large.
He noted that Japan's economy is likely to remain in a severe state, inflation to weaken adding that the global economy is rapidly worsening due to COVID-19.
Technical Analysis:
USD/JPY was trading 0.22% lower on the day at 107.40 at around 03:50 GMT after closing 0.95% higher in the previous session.
Price action has broken above 21-EMA, but is struggling at 55-EMA which is offering stiff resistance at 107.78.
Stochs have rolled over from oversold levels and MACD is showing a bullish crossover on signal line.
Minor trend as evidenced by the GMMA indicator has turned bullish and the parabolic SAR supports upside.
Major Support Levels:
- S1: 107.20 (21-EMA)
- S2: 106.80 (5-DMA)
- S3: 106.70 (Cloud base)
Major Resistance Levels:
- R1: 107.78 (55-EMA)
- R2: 108.22 (200-DMA)
- R3: 108.85 (50% Fib)
Summary: Technical indicators are turning bullish in the near-term. Trade war and COVID-19 fears keep demand for the yen.
Guidance: Watch out for break above 55-EMA for further upside. Next bull target lies at 200-DMA at 108.22 ahead of 50% Fib at 108.85.


