


 FxWirePro: EUR/AUD neutral in the near term, scope for downward resumption
  FxWirePro: GBP/USD slips as middle east tensions and oil surge pressure pound
  EUR/USD Slides After ECB Hold, Bearish Technicals Favor Rally Fades
  FxWirePro: USD/ZAR retreats slightly but bias is bullish
  FxWirePro: EUR/NZD firms after ECB holds rates steady at 2.25%
  FxWirePro: USD/CAD positions for another climb, eyes 1.4150 level
  FxWirePro: GBP/USD downtrend loses steam but outlook still bearish
  FxWirePro: GBP/AUD under pressure as pound continues to weaken
  FxWirePro- Major Crypto levels and bias summary
  AUDJPY Extends Four-Day Rally on Yen Weakness: Bullish Dip-Buy Eyes 117-118
  FxWirePro: EUR/NZD downside pressure builds, key support level in focus
  FxWirePro: GBP/AUD bears maintain upper hand
  NZDJPY Bullish Dip-Buy Setup: 93.60 Support Unlocks Path to 97
  FxWirePro- Major Crypto levels and bias summary
  FxWirePro: USD/ZAR surges as rand slumps after SARB rate hold surprise
  FxWirePro- Woodies pivot (Major)


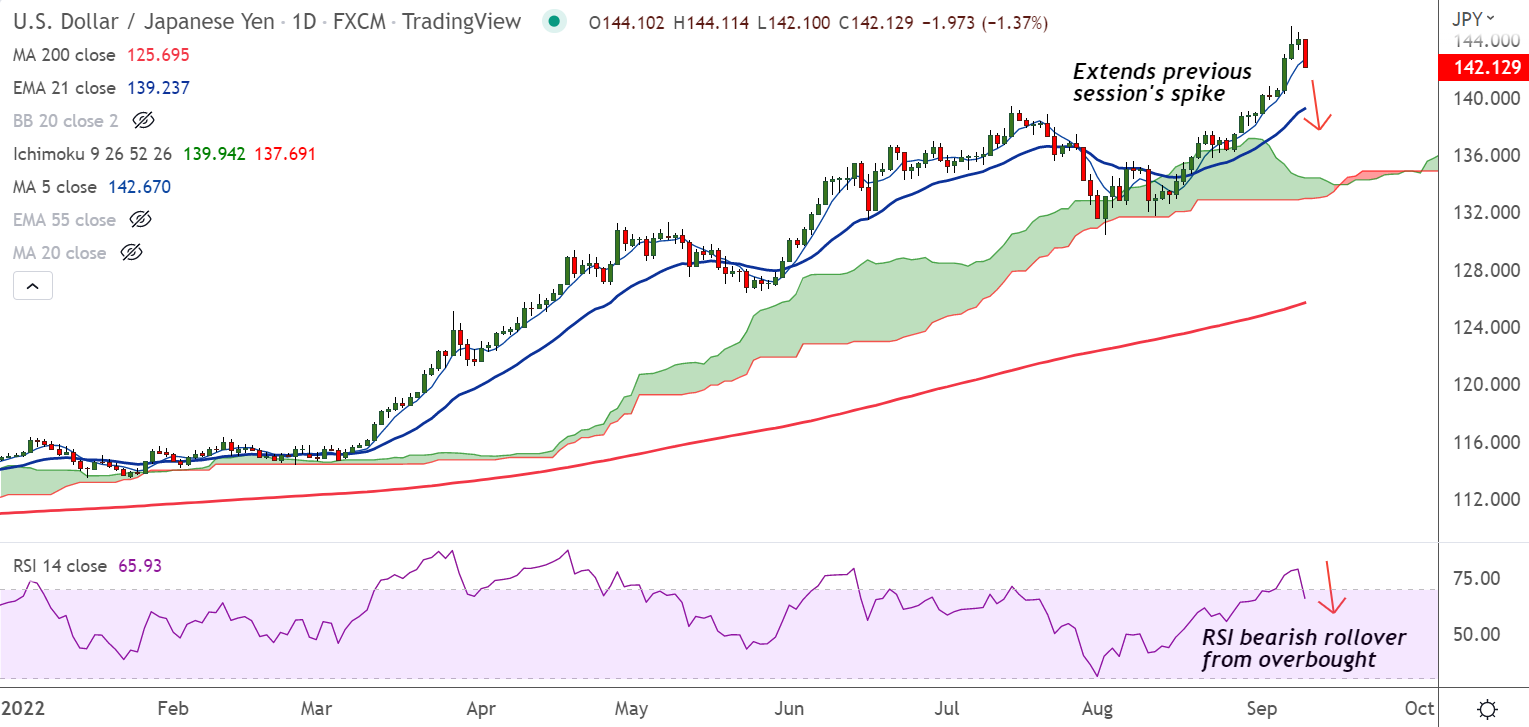
Chart - Courtesy Trading View
Spot Analysis:
USD/JPY was trading 1.27% lower on the day at 142.33 at around 07:50 GMT
Previous Week's High/ Low: 140.80/ 137.55
Previous Session's High/ Low: 144.55/ 143.31
Fundamental Overview:
Speculations that the Bank of Japan (BoJ) may soon step in to arrest the freefall in the Japanese yen adds downside pressure.
That said, Fed-BoJ policy divergence is likely to act as a tailwind for the major and limit deeper losses.
On the data front, US Weekly Initial Jobless Claims slumped to the lowest levels since May, with the latest figures beyond 222K.
With no major market-moving economic data due for release from the US, focus will be on Fed speak for impetus.
Technical Analysis:
- USD/JPY slips below 5-DMA, eyes 200H MA on the intraday charts
- GMMA indicator shows minor trend is bearish, while major trend is turning bearish on the intraday charts
- Stochs and RSI are at overbought levels, scope for bearish rollover
- ADX and MACD support upside in the pair, but Chikou span is biased lower
Major Support and Resistance Levels:
Support - 141.05 (200H MA), Resistance - 142.71 (5-DMA)
Summary: USD/JPY is seeing some long unwinding. Major trend remains bullish and pullbacks are likely to be shallow. Major weakness only below 21-EMA.


