
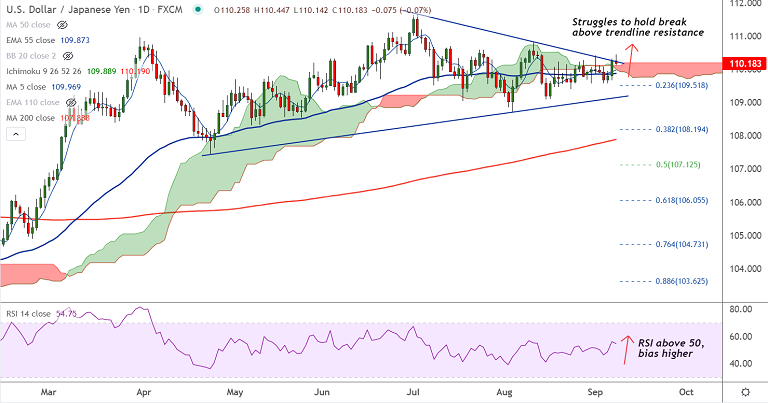
USD/JPY chart - Trading View
USD/JPY was trading 0.08% lower on the day at 110.17 at around 08:20 GMT, slips lower from session highs at 110.44.
The pair spiked higher after hawkish comments from Fed’s Bullard, extending previous session massive gains.
The major has broken above daily cloud and major trendline resistance, but has erased all gains to slip into the red.
Fed’s Bullard said that the Central bank should press ahead with a plan to dial down its massive pandemic stimulus.
Economic growth and covid concerns weigh on the investors' sentiment, cautious optimism seen in the markets.
Technical bias for the pair remains bullish on decisive breakout above major trendline resistance. Momentum indicators are biased higher.
As for now, investors turn their attention to US JOLTS job Openings for fresh trading impetus.
Support levels - 110.25 (Trendline support), 110.01 (5-DMA), 109.40 (110-EMA)
Resistance levels - 110.43 (Upper BB), 110.80 (Aug high), 111 (Psychological mark)
Summary: Technical bias for the pair remains bullish. Break out of 'Symmetric Triangle' pattern will open upside. Scope for test of 111 levels.


