
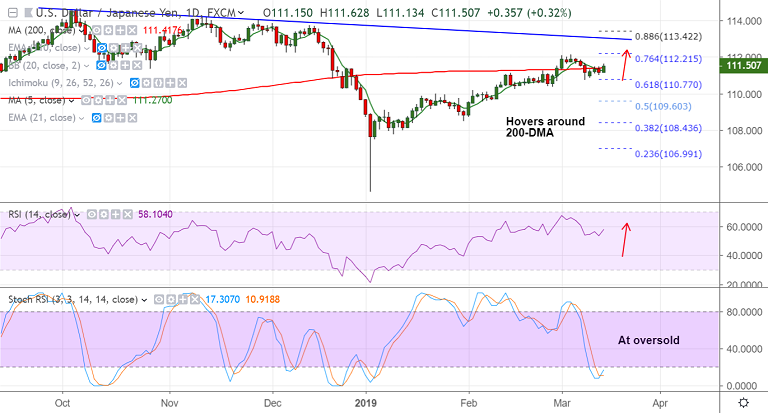
USD/JPY chart - Trading View
- USD/JPY hovers around 200-DMA at 111.41, decisive break above to see further upside.
- The pair is trading 0.37% higher on the day at 111.55 at 0420 GMT, bias bullish.
- The 10-year UST yield continues to recover from over 3-month lows below 2.6 percent hit earlier this week, supporting the USD.
- Technical studies on intraday charts are turning slightly bullish.
- Price action is probing 200-hour SMA resistance at 111.51, breakout could see further gains.
- RSI is above 50 and Stochs are at oversold levels which keep scope for reversal into neutral.
- 55-EMA is strong support at 110.83. Rejection at 200-DMA and retrace below 55-EMA will see weakness.
Support levels - 110.83 (55-EMA), 110 (trendline), 109.60 (50% Fib)
Resistance levels - 112, 112.13 (Mar 5 high), 112.25 (200-W SMA)
Recommendation: Stay long on decisive break above 200-Hour SMA at 111.51, SL: 110.80, TP: 112/ 112.25.
For details on FxWirePro's Currency Strength Index, visit http://www.fxwirepro.com/currencyindex.


