FxWirePro: USD/JPY weakness on technical glimpse; short futures for TP at 123.10
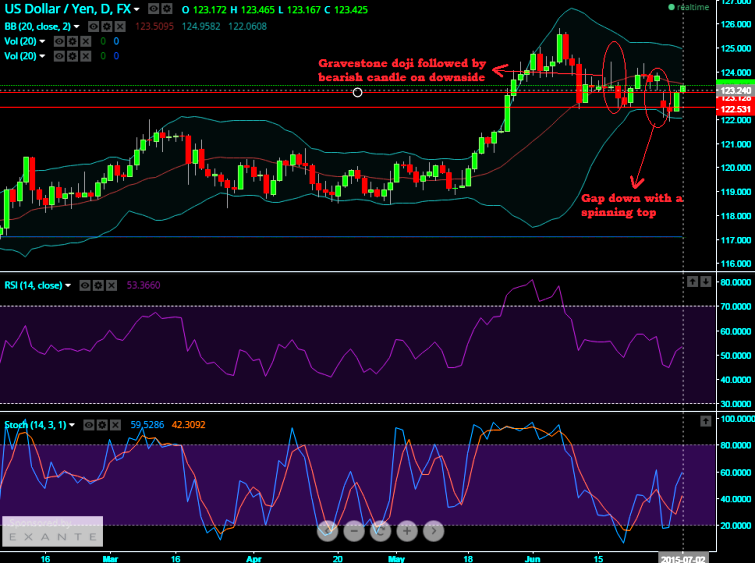
For today, intraday technical charts suggest little sideways to downward and an indication of little weakness in this pair on EOD charts as we traced a gap down opening with a spinning top candle pattern and more evident…
For today, intraday technical charts suggest little sideways to downward and an indication of little weakness in this pair on EOD charts as we traced a gap down opening with a spinning top candle pattern and more evidently these price patterns have been substantiated with abundant volumes. And in addition we believe it is testing support at 123.12 & at 122.50 levels if it manages to break these levels then we see all chances dragging until 122 levels back again.
The Gravestone Doji and shooting stars appeared on a market top and the next candle after doji also falls to the downside, it is a strong confirmation that the earlier doji's signal of market topping would sustain.
Oscillating indicators such as RSI (14) and slow stochastic curves are moving in convergence with prevailing price patterns.
RSI currently oscillating at 60.0323 while %D line cross over at above 80 levels on slow stochastic which is not that significant for both bulls and bears.
We look at either shorting futures for pair to hit targets of 123.10 & then even 122.80 levels or buying at binary puts for the same targets with a strict stop loss at 123.50. Thereby risk reward ratio would be at 0.33.
Australia's September 2026 labour report shocked to the negative: unemployment climbed to 4.7% from 4.6% and employment dropped by 39,300 against expectations for a 20,000 increase. Part-time work dropped by 73,700, whic…
UNCX Network, a cryptocurrency token vesting platform formerly known as UniCrypt, suffered a security exploit on Wednesday that drained approximately $86,000 from its shared Ethereum token pool. Blockchain security firm …
Solana is preparing to introduce its highly anticipated Alpenglow consensus upgrade on October 21, 2026, marking one of the blockchain's biggest technological changes since its launch in 2020. The upgrade aims to signifi…