


 FxWirePro: USD/ CNY falls towards 6.750, bears keep the advantage
  Geopolitical Easing Fuels AUDJPY Rally Toward 115 — Buy Dips at 113
  FxWirePro: GBP/NZD stuck in range but outlook is bullish
  Peace Dividend Powers NZDJPY Past 93.50 — Bulls Set Sights on 96.15 Target
  FxWirePro: GBP/USD range-bound as Iran uncertainty keeps traders cautious
  FxWirePro: GBP/AUD eases on Geopolitical whipsaw
  Relief Rally Extends to 112.75, but AUDJPY EMA Structure Favors Selling
  FxWirePro: AUD/USD climbs as US-Iran peace deal sparks risk rally
  Sell the Bounce: NZDJPY Bearish Bias Persists Below 94.20, Eyes 90.50
  FxWirePro- Woodies pivot (Major)
  FxWirePro: NZD/USD jumps after US and Iran agree preliminary deal
  FxWirePro- Woodies pivot (Major)
  FxWirePro- Major Crypto levels and bias summary


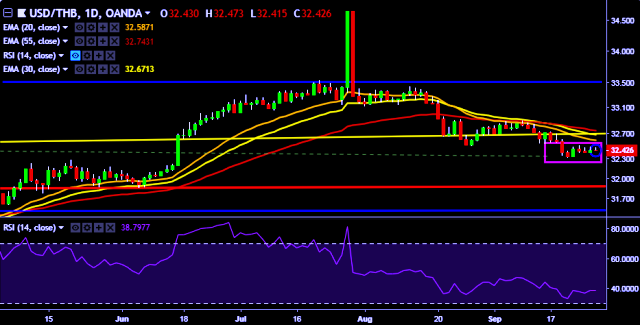
- USD/THB is currently trading around 32.42 marks.
- It made intraday high at 32.47 and low at 32.41 marks.
- Intraday bias remains neutral till the time holds key support at 32.32 mark.
- On the top side, key resistances are seen at 32.51, 32.70, 32.90, 32.90, 33.05, 33.20, 33.37, 33.52, 33.78 and 33.96 marks respectively.
- Alternatively, a daily close below 32.34 will drag the parity down towards key supports around 32.18, 32.02 and 31.85 marks respectively.
- Important to note here that 20D, 30D and 55D EMA heads down and confirms the bearish trend in a daily chart.
Positioning is inconclusive at this point, with prices offering no clear cut signal to initiate a long or short trade. We will continue to remain on sidelines for the time being.


