


 FxWirePro- Woodies pivot (Major)
  Ethereum Cracks Under $1,700: Sell the Rally Near $1,750 as Bears Eye $1,380–$1,200
  FxWirePro: EUR/AUD loses upside momentum but outlook is bullish
  Geopolitical Easing Fuels AUDJPY Rally Toward 115 — Buy Dips at 113
  FxWirePro- Major Crypto levels and bias summary
  FxWirePro: USD/JPY gains above 160 level ahead of BOJ policy meeting
  FxWirePro: USD/ CNY falls towards 6.750, bears keep the advantage
  FxWirePro: USD/ZAR edges higher, set to stay on back foot
  FxWirePro: GBP/AUD runs out of steam but maintains bullish outlook
  FxWirePro: USD/CAD steadies around 1.3990 ,retains bid one
  FxWirePro: GBP/USD range-bound as Iran uncertainty keeps traders cautious
  Relief Rally Extends to 112.75, but AUDJPY EMA Structure Favors Selling
  Sell the Bounce: NZDJPY Bearish Bias Persists Below 94.20, Eyes 90.50


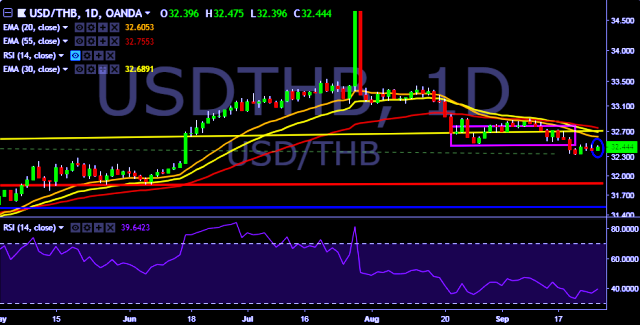
- USD/THB is currently trading around 32.44 marks.
- It made intraday high at 32.47 and low at 32.39 marks.
- Intraday bias remains neutral till the time holds key support at 32.32 mark.
- On the top side, key resistances are seen at 32.51, 32.70, 32.90, 32.90, 33.05, 33.20, 33.37, 33.52, 33.78 and 33.96 marks respectively.
- Alternatively, a daily close below 32.34 will drag the parity down towards key supports around 32.18, 32.02 and 31.85 marks respectively.
- Important to note here that 20D, 30D and 55D EMA heads down and confirms the bearish trend in a daily chart.
We prefer to take short position on USD/THB only below 32.32, stop loss at 32.50 and target of 32.18/32.02.


