


 FxWirePro: USD/ZAR gains as stronger dollar outweighs upbeat South Africa's trade surplus
  Major European Indices Score Extremely Bullish: DAX Eyes 26000, CAC Targets 8600, FTSE100 at 11000 – Key Levels to Watch
  AUD/JPY Slips Below 112 as BOJ Intervention Sparks Bearish Momentum: Sell the Rallies
  JPY Currency Meter Signals: NZDJPY Bullish (+25) vs CHFJPY (-100) – These Pairs Could Move Next
  FxWirePro- Major Crypto levels and bias summary
  NZDJPY Bullish Rebound: Buy Dips as EMAs Align for 97 Target
  FxWirePro:USD/JPY climbs back above 160.00 after BOJ rate decision
  FxWirePro- Major Crypto levels and bias summary
  FxWirePro: USD/CAD retreats after Canada posts stronger-than-expected GDP growth
  Nikkei Surges Past 65,000 on Suspected Yen Weakness: Tech Giants Like Advantest and NEC Lead Explosive Gains
  NZDJPY Retreats on Yen Strength – Bearish Setup Targets 90 After Hitting 92.75 Low
  AUDJPY Volatile After Massive Sell-Off: Sell Rallies at 113, Targeting 110 as Bearish Momentum Surges
  FxWirePro- Woodies pivot (Major)
  FxWirePro: USD/CNY dips to hit three year low,scope for further downside
  FxWirePro: GBP/AUD drifts lower after BOE rate decision
  FxWirePro- Woodies pivot (Major)


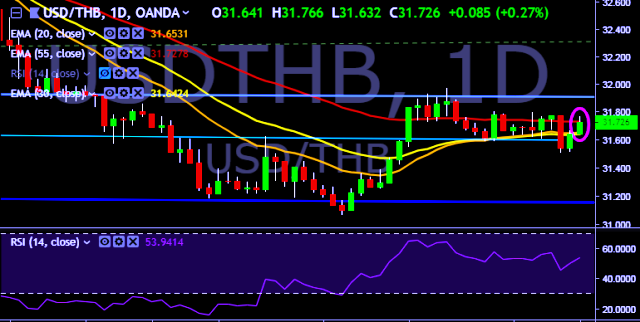
- USD/THB is currently trading around 31.72 marks.
- It made intraday high at 31.76 and low at 31.63 marks.
- Intraday bias remains neutral till the time pair holds key resistance at 31.78 mark.
- On the top side, key resistances are seen at 31.78, 31.92, 32.02, 32.10, 32.22 and 32.54 marks respectively.
- Alternatively, a daily close below 31.60 will drag the parity down towards key supports around 31.50, 31.42, 31.28, 31.20 and 31.06 marks respectively.
- Important to note here that 20D, 30D and 55D EMA heads down and confirms the bearish trend in a daily chart.
We prefer to take long position on USD/THB only above 31.78, stop loss 31.60 and target of 32.02.


