


 Major FX Action Bias & US Market Sentiment: NZD/USD (Extremely Bullish) & AUD/USD (Bullish) Watchlist
  FxWirePro- Woodies pivot (Major)
  FxWirePro: EUR/ AUD dips below 1.6400 level, focus on near term support
  AUD/JPY Slips Below 112 as BOJ Intervention Sparks Bearish Momentum: Sell the Rallies
  FxWirePro: GBP/USD rises as soft US data pressures dollar
  FxWirePro- Major Crypto levels and bias summary
  US Magnificent 7 Stocks Trend Score: Amazon & Microsoft Hit Extreme Bullish (+100) as Meta Drops to -100 — Key Resistance & Support Watchlist
  US Magnificent 7 Stocks Trend Score: Amazon & Microsoft Hit Extreme Bullish (+100) as Meta Drops to -100 — Key Resistance & Support Watchlist
  FxWirePro: GBP/NZD remains weak, eyes 38.2%fib support
  FxWirePro:USD/JPY climbs back above 160.00 after BOJ rate decision
  FxWirePro: GBP/AUD drifts lower after BOE rate decision
  FxWirePro: USD/CNY dips to hit three year low,scope for further downside
  FxWirePro: AUD/USD gains some ground but outlook is bearish
  NZDJPY Retreats on Yen Strength – Bearish Setup Targets 90 After Hitting 92.75 Low
  FxWirePro- Major Pair levels and bias summary
  FxWirePro: GBP/NZD remains weak, eyes 38.2%fib support


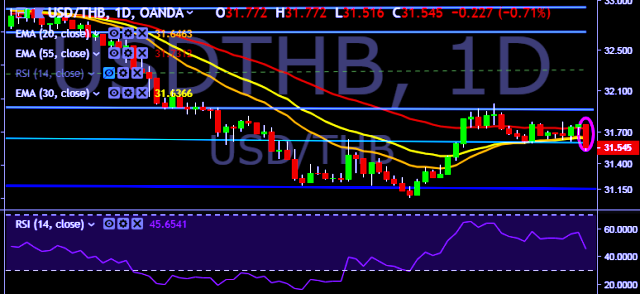
- USD/THB is currently trading around 31.54 marks.
- It made intraday high at 31.77 and low at 31.51 marks.
- Intraday bias remains bearish till the time pair holds key resistance at 31.78 mark.
- On the top side, key resistances are seen at 31.78, 31.92, 32.02, 32.10, 32.22 and 32.54 marks respectively.
- Alternatively, a daily close below 31.60 will drag the parity down towards key supports around 31.42, 31.28, 31.20 and 31.06 marks respectively.
- Important to note here that 20D, 30D and 55D EMA heads down and confirms the bearish trend in a daily chart.
We prefer to take short position on USD/THB around 31.58, stop loss 31.78 and target of 31.20.


