


 FxWirePro- Major Crypto levels and bias summary
  NZDJPY Retreats on Yen Strength – Bearish Setup Targets 90 After Hitting 92.75 Low
  FxWirePro- Major Pair levels and bias summary
  FxWirePro: GBP/NZD remains weak, eyes 38.2%fib support
  FxWirePro: AUD/USD gains some ground but outlook is bearish
  FxWirePro: GBP/AUD bears maintain upper hand
  Nikkei Surges Past 65,000 on Suspected Yen Weakness: Tech Giants Like Advantest and NEC Lead Explosive Gains
  FxWirePro: GBP/NZD remains weak, eyes 38.2%fib support
  FxWirePro: GBP/USD rises as soft US data pressures dollar
  Major European Indices Score Extremely Bullish: DAX Eyes 26000, CAC Targets 8600, FTSE100 at 11000 – Key Levels to Watch
  US Magnificent 7 Stocks Trend Score: Amazon & Microsoft Hit Extreme Bullish (+100) as Meta Drops to -100 — Key Resistance & Support Watchlist
  FxWirePro: USD/JPY dips as market assess risk of additional FX intervention.
  FxWirePro- Major Crypto levels and bias summary
  Major FX Action Bias & US Market Sentiment: NZD/USD (Extremely Bullish) & AUD/USD (Bullish) Watchlist
  AUD/JPY Slips Below 112 as BOJ Intervention Sparks Bearish Momentum: Sell the Rallies
  FxWirePro- Woodies pivot (Major)


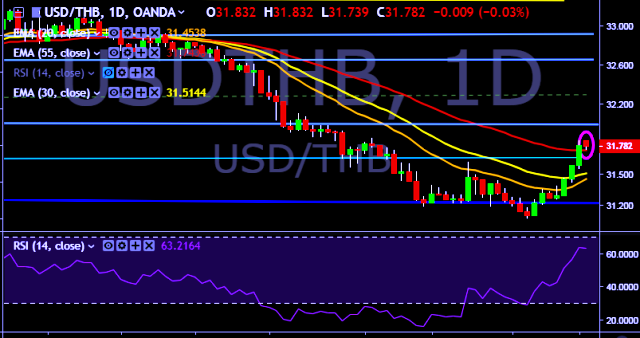
- USD/THB is currently trading around 31.78 marks.
- It made intraday high at 31.83 and low at 31.73 marks.
- Intraday bias remains neutral for the moment.
- On the top side, key resistances are seen at 31.93, 32.02 and 32.10 marks respectively.
- Alternatively, a daily close below 31.80 will drag the parity down towards key supports around 31.54, 31.42, 31.28, 31.20, 31.06, 30.94, 30.20 and 29.66 marks respectively.
- Important to note here that 20D, 30D and 55D EMA heads down and confirms the bearish trend in a daily chart.
We prefer to take long position on USD/THB only above 31.83, stop loss at 31.70 and target of 31.93/32.02 mark.


