


 Ethereum Braces for Volatility: Technicals Turn Bearish as Geopolitical Tensions Loom
  EUR/JPY Breaks Out: Euro Surges Past 185.00 Resistance Amid Strong Bullish Momentum
  Aussie Ascent: AUDJPY Reclaims 110.00 as Bullish Momentum Ignites
  NZDJPY Bearish Breakdown: Why Selling the Rallies is the Strategic Play
  FxWirePro- Major European Indices
  FxWirePro: GBP/USD stuck in range but maintains bearish bias
  FxWirePro- Major Crypto levels and bias summary
  FxWirePro: USD/JPY edges up as yen dips after soft household spending data
  FxWirePro- Major Crypto levels and bias summary
  Kiwi Under Pressure: NZDJPY Signals Bearish Turn as Resistance at 92.00 Holds Firm
  FxWirePro- Major Pair levels and bias summary
  FxWirePro- Woodies Pivot(Major)
  Aussie Ascent: AUDJPY Charges Toward 112 as Bullish Momentum Hits Five-Day High
  Bitcoin Resilience: BTC Reclaims USD 69,000 as Geopolitical Tensions Ease


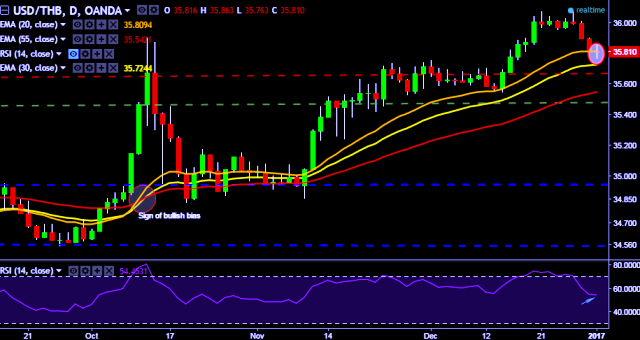
- USD/THB is currently trading around 35.80 marks.
- It made intraday high at 35.86 and low at 35.76 marks.
- Intraday bias remains bearish till the time pair holds key resistance at 35.90 mark.
- On the top side key resistances are seen at 35.90, 36.01, 36.08, 36.39 and 36.66 marks respectively.
- Alternatively, a daily close below 35.80 will drag the parity down towards key supports around 35.67, 35.54, 35.41, 35.23, 35.04, 34.83, 34.64, 34.51 and 34.20 marks respectively.
- Important to note here that 20D, 30D and 55D EMA heads up and confirms the bullish trend in a daily chart. Current downside movement is short term trend correction only.
We prefer to take short position in USD/THB around 35.82, stop loss at 35.90 and target of 35.67/35.54.


