


 FxWirePro:USD/JPY climbs back above 160.00 after BOJ rate decision
  AUDJPY Volatile After Massive Sell-Off: Sell Rallies at 113, Targeting 110 as Bearish Momentum Surges
  FxWirePro: NZD/USD consolidates overnight gains, but loses momentum
  FxWirePro- Woodies pivot (Major)
  FxWirePro: GBP/AUD bears maintain upper hand
  NZDJPY Retreats on Yen Strength – Bearish Setup Targets 90 After Hitting 92.75 Low
  FxWirePro- Major Pair levels and bias summary
  FxWirePro: USD/CAD retreats after Canada posts stronger-than-expected GDP growth
  FxWirePro: EUR/ AUD dips below 1.6400 level, focus on near term support
  Major FX Action Bias & US Market Sentiment: NZD/USD (Extremely Bullish) & AUD/USD (Bullish) Watchlist
  FxWirePro: AUD/USD gains some ground but outlook is bearish
  US Magnificent 7 Stocks Trend Score: Amazon & Microsoft Hit Extreme Bullish (+100) as Meta Drops to -100 — Key Resistance & Support Watchlist
  FxWirePro: GBP/USD rises as soft US data pressures dollar
  FxWirePro- Major Crypto levels and bias summary
  US Magnificent 7 Stocks Trend Score: Amazon & Microsoft Hit Extreme Bullish (+100) as Meta Drops to -100 — Key Resistance & Support Watchlist
  Nikkei Surges Past 65,000 on Suspected Yen Weakness: Tech Giants Like Advantest and NEC Lead Explosive Gains


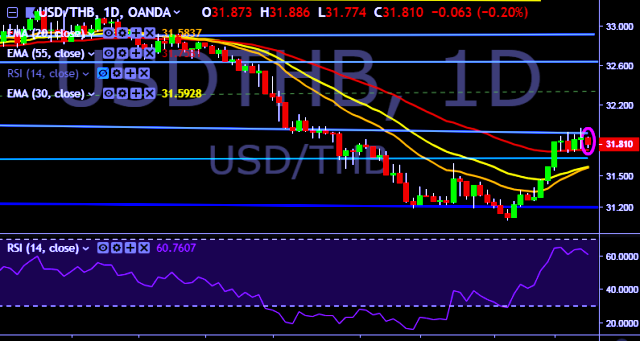
- USD/THB is currently trading around 31.81 marks.
- It made intraday high at 31.88 and low at 31.77 marks.
- Intraday bias remains neutral till the time pair holds key resistance at 31.92 mark.
- On the top side, key resistances are seen at 31.92, 32.02, 32.10, 32.22 and 32.54 marks respectively.
- Alternatively, a daily close below 31.76 will drag the parity down towards key supports around 31.54, 31.42, 31.28, 31.20, 31.06, 30.94, 30.20 and 29.66 marks respectively.
- Important to note here that 20D, 30D and 55D EMA heads down and confirms the bearish trend in a daily chart.
Positioning is inconclusive at this point, with prices offering no clear cut signal to initiate a long or short trade. We will continue to remain on sidelines for the time being.


