


 FxWirePro: GBP/AUD drifts lower after BOE rate decision
  AUDJPY Volatile After Massive Sell-Off: Sell Rallies at 113, Targeting 110 as Bearish Momentum Surges
  FxWirePro: GBP/USD rises as soft US data pressures dollar
  FxWirePro: GBP/AUD bears maintain upper hand
  FxWirePro- Major Crypto levels and bias summary
  Nikkei Surges Past 65,000 on Suspected Yen Weakness: Tech Giants Like Advantest and NEC Lead Explosive Gains
  AUD/JPY Slips Below 112 as BOJ Intervention Sparks Bearish Momentum: Sell the Rallies
  FxWirePro- Major Pair levels and bias summary
  FxWirePro- Major Crypto levels and bias summary
  FxWirePro: NZD/USD consolidates overnight gains, but loses momentum
  NZDJPY Bullish Rebound: Buy Dips as EMAs Align for 97 Target
  FxWirePro: USD/CNY dips to hit three year low,scope for further downside
  FxWirePro- Major Pair levels and bias summary
  JPY Currency Meter Signals: NZDJPY Bullish (+25) vs CHFJPY (-100) – These Pairs Could Move Next
  FxWirePro- Woodies pivot (Major)


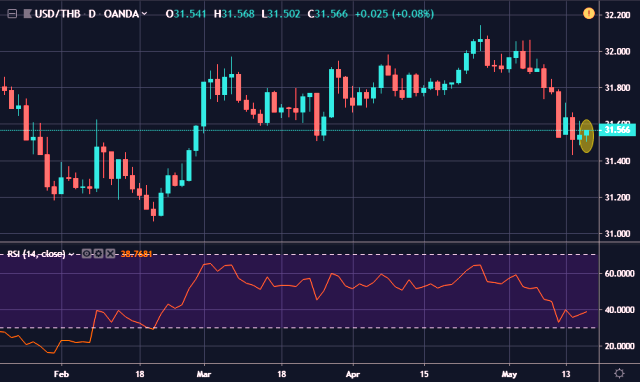
- USD/THB is currently trading around 31.56 marks.
- It made intraday high at 31.56 and low at 31.50 marks.
- Intraday bias remains neutral till the time pair holds key resistance at 31.70 mark.
- On the top side, key resistances are seen at 31.70, 31.92, 32.10, 32.22 and 32.54 marks respectively.
- Alternatively, a daily close below 31.54 will drag the parity down towards key supports around 31.40, 31.28, 31.20 and 31.06 marks respectively.
- Important to note here that 20D, 30D and 55D EMA heads down and confirms the bearish trend in a daily chart.
We prefer to take long position on USD/THB around 31.55, stop loss at 31.40 and target of 31.70/31.92.


