


 GBPJPY Coil Tightens: Is a Bullish Break Above 215.60 Imminent?
  Geopolitical Easing Fuels AUDJPY Rally Toward 115 — Buy Dips at 113
  FxWirePro: GBP/NZD stuck in range but outlook is bullish
  FxWirePro: NZD/USD jumps after US and Iran agree preliminary deal
  FxWirePro: USD/CAD steadies around 1.3990 ,retains bid one
  FxWirePro: USD/JPY gains above 160 level ahead of BOJ policy meeting
  FxWirePro: AUD/USD climbs as US-Iran peace deal sparks risk rally
  FxWirePro: USD/ZAR edges higher, set to stay on back foot
  FxWirePro: AUD/ USD strongly bearish despite upside attempts
  FxWirePro: GBP/AUD runs out of steam but maintains bullish outlook
  BTC’s Bear Bounce: Sell the Rally Near $66K as Bears Target $59K–$52K Breakdown
  FxWirePro: EUR/ NZD uptrend loses steam, remains on bullish path
  FxWirePro- Woodies pivot (Major)
  Relief Rally Extends to 112.75, but AUDJPY EMA Structure Favors Selling


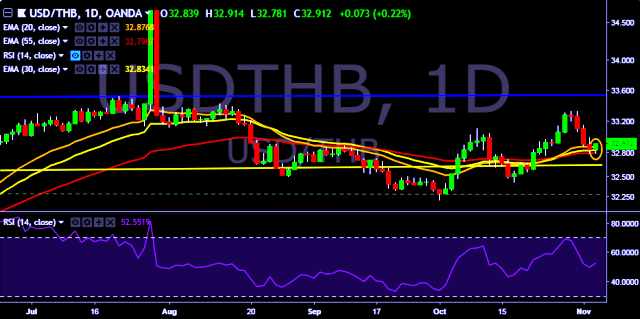
- USD/THB is currently trading around 32.90 marks.
- It made intraday high at 32.91 and low at 32.78 marks.
- Intraday bias remains bullish till the time pair holds key support at 32.70 mark.
- On the top side, key resistances are seen at 33.02, 33.15, 33.32, 33.52, 33.78 and 33.96 marks respectively.
- Alternatively, a daily close below 32.83 will drag the parity down towards key supports around 32.77, 32.57 and 32.42 marks respectively.
- Important to note here that 20D, 30D and 55D EMA heads up and confirms the bullish trend in a daily chart.
We prefer to take long position on USD/THB around 32.88, stop loss 32.77 and target of 33.02/33.15.


