


 FxWirePro: GBP/USD rises as soft US data pressures dollar
  FxWirePro- Woodies pivot (Major)
  FxWirePro: USD/ZAR gains as stronger dollar outweighs upbeat South Africa's trade surplus
  Major European Indices Score Extremely Bullish: DAX Eyes 26000, CAC Targets 8600, FTSE100 at 11000 – Key Levels to Watch
  US Magnificent 7 Stocks Trend Score: Amazon & Microsoft Hit Extreme Bullish (+100) as Meta Drops to -100 — Key Resistance & Support Watchlist
  NZDJPY Retreats on Yen Strength – Bearish Setup Targets 90 After Hitting 92.75 Low
  FxWirePro: USD/JPY dips as market assess risk of additional FX intervention.
  FxWirePro: GBP/AUD drifts lower after BOE rate decision
  FxWirePro: AUD/USD gains some ground but outlook is bearish
  AUD/JPY Slips Below 112 as BOJ Intervention Sparks Bearish Momentum: Sell the Rallies
  FxWirePro- Woodies pivot (Major)
  JPY Currency Meter Signals: NZDJPY Bullish (+25) vs CHFJPY (-100) – These Pairs Could Move Next
  FxWirePro: GBP/AUD bears maintain upper hand
  Nikkei Surges Past 65,000 on Suspected Yen Weakness: Tech Giants Like Advantest and NEC Lead Explosive Gains
  FxWirePro:USD/JPY climbs back above 160.00 after BOJ rate decision


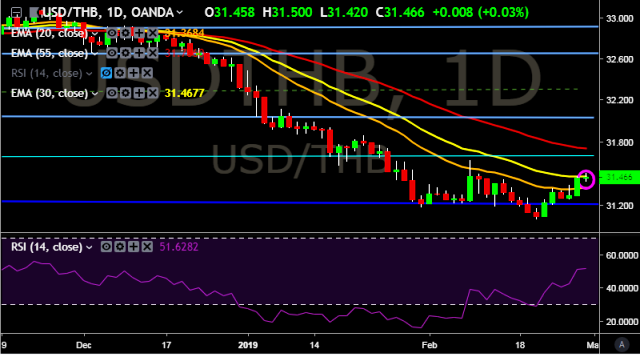
- USD/THB is currently trading around 31.46 marks.
- It made intraday high at 31.50 and low at 31.42 marks.
- Intraday bias remains bullish for the moment.
- On the top side, key resistances are seen at 31.62, 31.70, 31.93, 32.02 and 32.10 marks respectively.
- Alternatively, a daily close below 31.45 will drag the parity down towards key supports around 31.28, 31.20, 31.06, 30.94, 30.20 and 29.66 marks respectively.
- Important to note here that 20D, 30D and 55D EMA heads down and confirms the bearish trend in a daily chart. Current upside movement is short term trend correction only.
- Thailand will release various economic data around 0730 GMT.
We prefer to take long position on USD/THB around 31.45, stop loss at 31.28 and target of 31.62 mark.


