


 Major FX Action Bias & US Market Sentiment: NZD/USD (Extremely Bullish) & AUD/USD (Bullish) Watchlist
  FxWirePro: GBP/NZD remains weak, eyes 38.2%fib support
  FxWirePro:USD/JPY climbs back above 160.00 after BOJ rate decision
  AUDJPY Volatile After Massive Sell-Off: Sell Rallies at 113, Targeting 110 as Bearish Momentum Surges
  Major European Indices Score Extremely Bullish: DAX Eyes 26000, CAC Targets 8600, FTSE100 at 11000 – Key Levels to Watch
  FxWirePro: EUR/ AUD dips below 1.6400 level, focus on near term support
  FxWirePro- Major Crypto levels and bias summary
  FxWirePro: GBP/NZD remains weak, eyes 38.2%fib support
  FxWirePro: GBP/USD rises as soft US data pressures dollar
  US Magnificent 7 Stocks Trend Score: Amazon & Microsoft Hit Extreme Bullish (+100) as Meta Drops to -100 — Key Resistance & Support Watchlist
  JPY Currency Meter Signals: NZDJPY Bullish (+25) vs CHFJPY (-100) – These Pairs Could Move Next
  Nikkei Surges Past 65,000 on Suspected Yen Weakness: Tech Giants Like Advantest and NEC Lead Explosive Gains
  FxWirePro- Woodies pivot (Major)
  US Magnificent 7 Stocks Trend Score: Amazon & Microsoft Hit Extreme Bullish (+100) as Meta Drops to -100 — Key Resistance & Support Watchlist
  NZDJPY Bullish Rebound: Buy Dips as EMAs Align for 97 Target


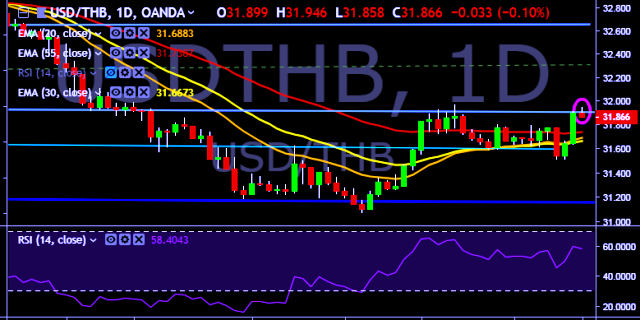
- USD/THB is currently trading around 31.85 marks.
- It made intraday high at 31.94 and low at 31.85 marks.
- Intraday bias remains neutral till the time pair holds key resistance at 31.94 mark.
- On the top side, key resistances are seen at 31.92, 32.02, 32.10, 32.22 and 32.54 marks respectively.
- Alternatively, a daily close below 31.89 will drag the parity down towards key supports around 31.70, 31.50, 31.42, 31.28, 31.20 and 31.06 marks respectively.
- Important to note here that 20D, 30D and 55D EMA heads down and confirms the bearish trend in a daily chart.
We prefer to take long position on USD/THB only above 31.94, stop loss 31.80 and target of 32.22.


