


 FxWirePro- Major European Indices
  FxWirePro: AUD/USD slips amid wavering risk sentiment
  FxWirePro: USD/ZAR continues to recovers , upside pressure builds
  FxWirePro- Woodies Pivot(Major)
  FxWirePro: GBP/AUD downtrend extends, eyes 1.8900 evel
  FxWirePro- Major Pair levels and bias summary
  FxWirePro: EUR/ NZD downside pressure builds, key support level in focus
  FxWirePro: GBP/NZD edges up, remains on front foot
  FxWirePro- Major Crypto levels and bias summary
  FxWirePro: USD/CNY drifts lower, vulnerable to more downside
  FxWirePro- Major Crypto levels and bias summary
  FxWirePro: GBP/NZD reverses course, bias back to downside
  FxWirePro: NZD/USD neutral in the near-term, scope for downward resumption
  EUR/JPY Breaks Out: Euro Surges Past 185.00 Resistance Amid Strong Bullish Momentum
  Bitcoin's Tug-of-War: Bulls Eye 80,000 USD Despite Turbulent ETF Outflows


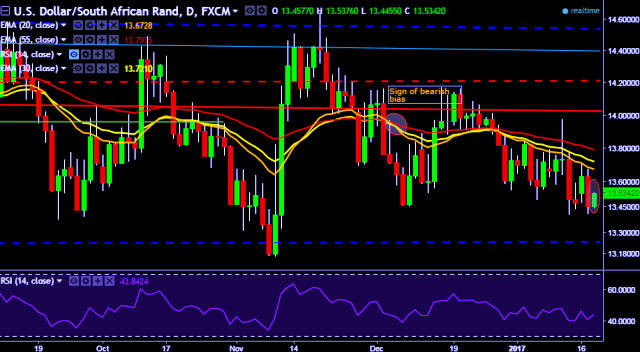
- USD/ZAR is currently trading around 13.52 levels.
- It made intraday high at 13.53 and low at 13.44 levels.
- Intraday bias remains slightly bullish till the time pair holds key support at 13.42 mark.
- A daily close above 13.45 will take the parity higher towards key resistances around 13.68, 13.77, 13.85, 13.96, 14.16, 14.29, 14.50, 14.75, 14.96, 15.05, 15.28, 15.45, 15.66, 15.77, 15.86 (February 29, 2016 high) and 16.15 marks respectively.
- Alternatively, a daily close below 13.45 will drag the parity down towards key supports at 13.40 13.32, 13.19, 13.01, 12.82 and 12.58 levels respectively.
- Important to note here that 20D, 30D and 55D EMA heads down and confirms the bearish trend in a daily chart. Current upside movement is short term trend correction only.
We prefer to take long position in USD/ZAR around 13.50, stop loss at 13.41 and taget of 13.62/13.68.


