
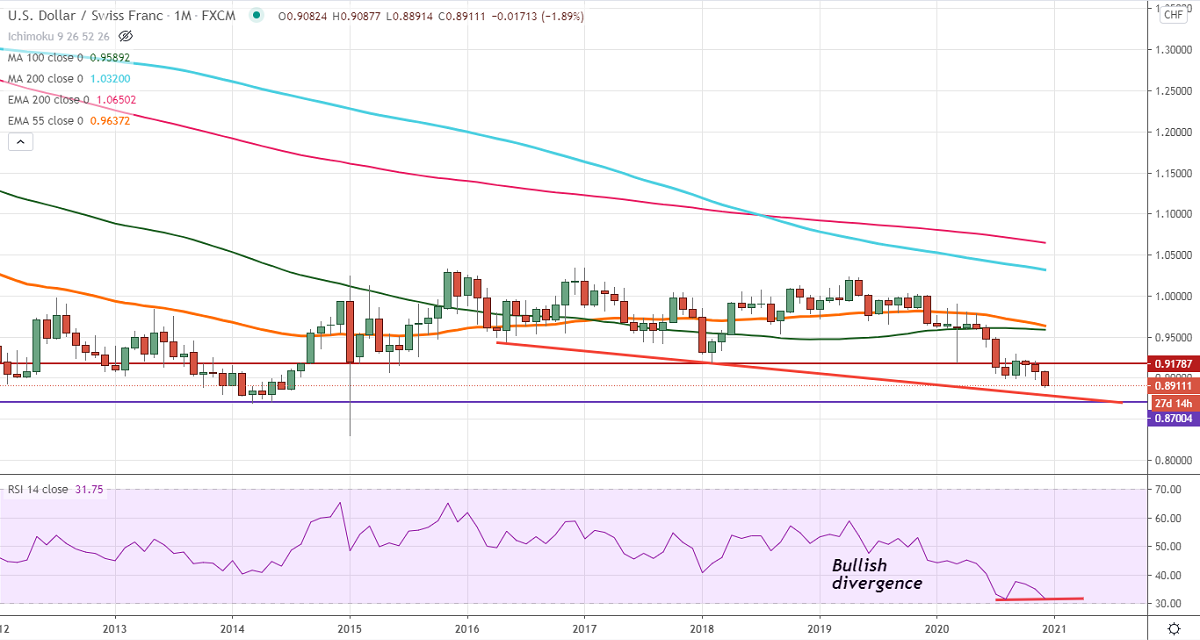
Chart pattern- Bullish Divergence (RSI)
USDCHF was one of the worst performers this month and lost more than 150 pips from a high of 0.908774. The selling was mainly due to broad-based US dollar selling. DXY hits 32 months low and trading below 91 levels on COVID vaccine optimism and stimulus hopes. US ISM services index came at six months low in November at 55.9 vs estimate of 55.90, while the number of people filed for unemployment benefits declined to 712000 compared to a forecast of 775K.
The pair is facing strong resistance at 0.8920 and any break above will take to the next level till 0.8945/0.8988. Minor bullishness only above 0.9000. On the lower side, the near term support is around 0.88460, and a dip till 0.8800 is possible.
It is good to buy on dips around 0.8900 with SL around 0.8880 for TP of 0.8980.


