


 FxWirePro: AUD/USD bulls struggles as upside momentum fades
  FxWirePro: AUD/USD rallies on jobs surge, heads to test key resistance
  FxWirePro- Major Crypto levels and bias summary
  Major Crypto Action Bias: ETHUSD Turns Bullish – Only Bullish Pair to Watch
  FxWirePro:USD/JPY hovers near 40-year peak,intervention fears linger
  FxWirePro- Major Pair levels and bias summary
  Major Pair Action Bias: USDCHF Turns Bullish as EURUSD Stays Bearish – Key Pairs to Watch
  FxWirePro: EUR/ AUD dips below 1.6300 level, focus on near term support
  FxWirePro: USD/CNY attracts selling interest, vulnerable to more downside
  FxWirePro: GBP/AUD downtrend loses steam but outlook still bearish
  FxWirePro: USD/CNY gains some upside momentum but bias still bearish
  FxWirePro: GBP/NZD gains some upside momentum but still bearish
  FxWirePro: GBP/AUD dips amid heightened Geopolitical concerns
  GBPJPY Weakens on Soft UK CPI: Sell Below 217.80 Targeting 216.40


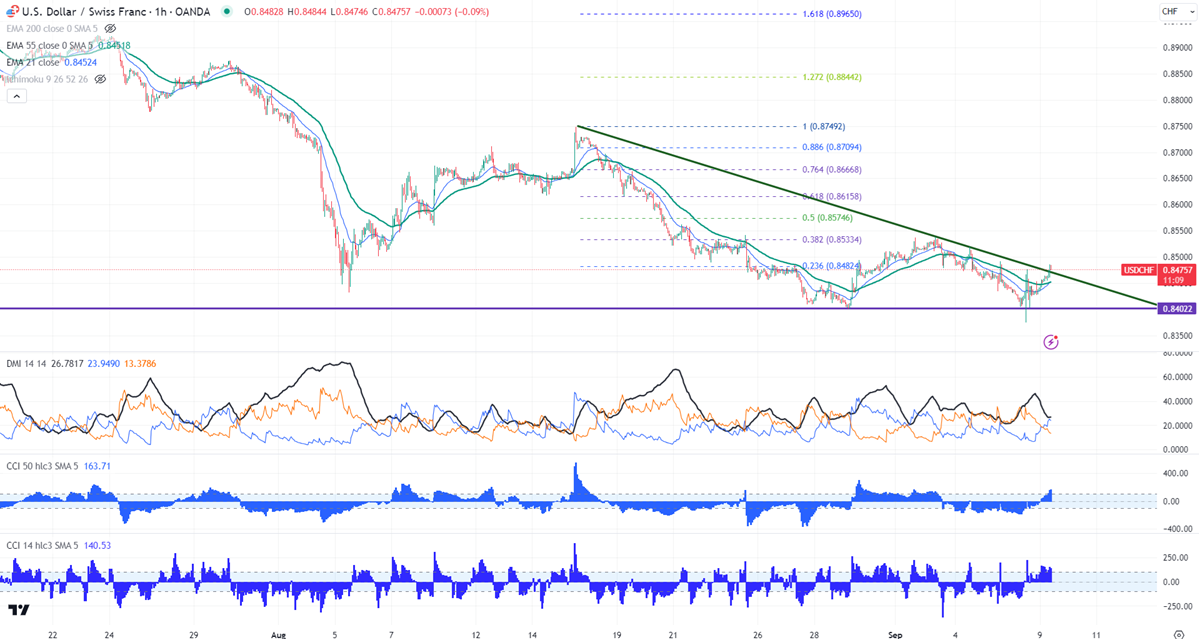
Chart pattern- Descending triangle break out
USDCHF formed a double bottom around 0.8400 and showed a minor pullback. It hit a high of 0.84854 and is currently trading around 0.84765.
Intraday trend is bullish as long as support of 0.840 holds.
Technicals-
The pair trades below 34 and 55 EMA in the one-hour chart.
The near-term resistance is around 0.84860, a breach above targets 0.8500/0.8540. The bearish pattern from 0.92244 will be completed at 0.8375 if the pair breaks above 0.8540. The immediate support is at 0.84500, any violation below will drag the pair to 0.8430/0.8400/0.8365 (61.% fib projection)/0.8340.
Indicator (1-hour chart)
CCI (14)- Bullish
CCI (50)- Bullish
Average directional movement Index - Bullish. Overall trend is bullish
It is good to buy on dips around 0.8480 with SL around 0.8450 for a TP of 0.8540.


