


 JPY Action Bias: Bullish Winds Strengthen – NZDJPY Leads the Charge as Top Pair to Watch
  AUDJPY Surges on Aussie Strength: Buy Dips Toward 117/118 as Bullish Momentum Accelerates
  ETHUSD Breaks Above $1900 as Bulls Eye $2300 and Beyond
  FxWirePro: USD/CNY dips as yuan firms as investors await policy cues
  FxWirePro: USD/CAD advances as loonie dips on softer Inflation and Middle East uncertainty
  Major Pairs Action Bias: NZDUSD Turns Extremely Bullish as EURUSD Stays Bearish – AUDUSD Emerges as Key Bullish Pair to Watch
  Bitcoin Holds Above $65K as Institutional Inflows Resume; Buy Dips Near $64K
  FxWirePro: GBP/USD falls as investors assess Britain's political transition
  FxWirePro:GBP/AUD slips as markets assess Burnham's rise to UK premiership
  FxWirePro: AUD/USD edges higher as US- Iran war escalates
  FxWirePro- Woodies pivot (Major)
  FxWirePro:USD/JPY hovers near 40-year, bias bullish
  FxWirePro: AUD/USD better risk puts bulls back in charge
  JPY Action Bias: NZDJPY and AUDJPY Stand Out as the Most Bullish Pairs
  FxWirePro:EUR/NZD downside pressure builds, key support level in focus
  FxWirePro: GBP/NZD downtrend extends, remains on bearish path
  FxWirePro: EUR/NZD outlook weaker on renewed downside pressure


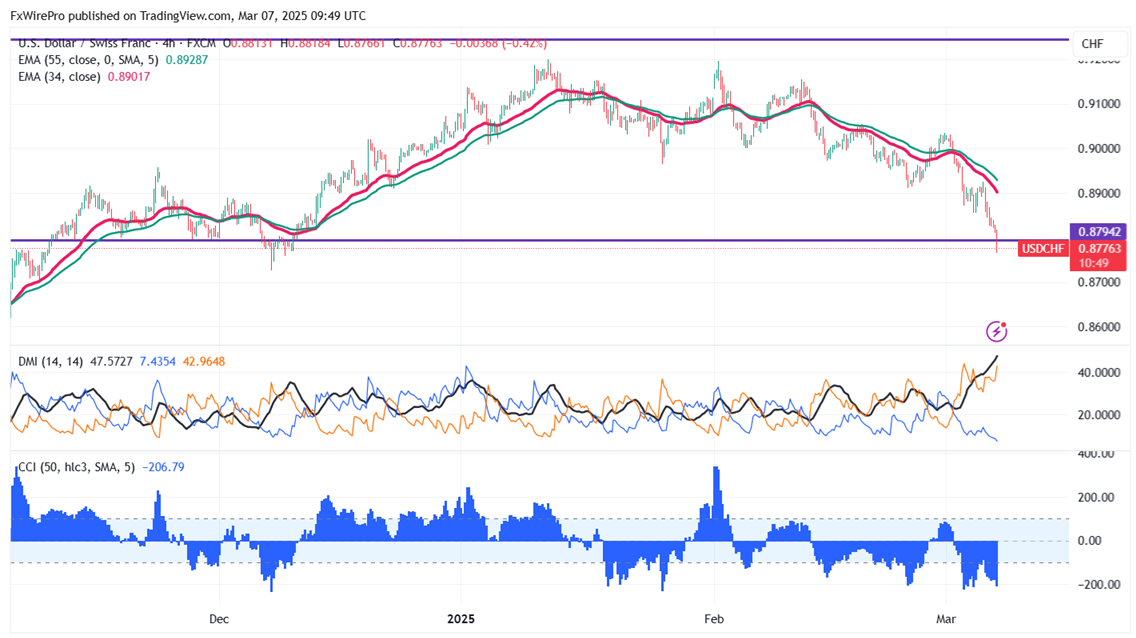
The currency pair declined once again after a minor pullback. It hit an intraday high of 0.89248 and is currently trading around 0.88658. The intraday bias appears to be bearish as long as the resistance 0.9000 holds.
US jobless claims reflect mixed signals: in the week to March 1, 2025, initial claims fell 21,000 to 221,000, below the forecast of 235,000, as continuing claims rose to a near-three-year peak, indicating the inability to secure new jobs. This follows a spike in February when initial claims hit a two-month high of 242,000, which was above expectations. Moreover, federal reductions in force by the Department of Government Efficiency (DOGE) are reported separately under the UCFE program and are not part of state claims data
Technical Analysis and Resistance Levels
The pair is trading below the 34-EMA and 55-EMA on the 4-hour chart indicating a bearish trend. The immediate resistance is at 0.8940 any break above targets 0.9000/0.9035/0.9070/0.9100/0.9150/0.9200/0.92250/0.9275/0.9030.
Support Levels and Potential Declines
On the downside, near-term support is around 0.87600, any violation below will drag the pair to 0.8720/0.8660.
Bullish Indicators
CCI (50) - Bearish
Directional movement Index - Bearish
Trading Strategy Recommendation
It is good to sell on rallies around 0.88180-20 with a stop-loss at 0.8870 for a TP of 0.8720.


