


 FxWirePro: USD/ZAR firms ahead of Fed interest rate decision
  FxWirePro: EUR/AUD regains upwards momentum but unable to hold above 50%fib level
  FxWirePro: USD/CAD runs out of steam but maintains bullish outlook
  Buy the Dips on EUR/JPY: Bullish Structure Points to 188 Target Ahead of Fed
  EURUSD Spikes to 1.14306 on Fed Pause as Traders Eye Sell-the-Rally Setup
  FxWirePro: GBP/USD edges higher as traders await BoE guidance and UK fiscal clarity
  Major Forex Pairs Action Bias: GBPUSD and AUDUSD Turn Extremely Bearish
  FxWirePro:EUR/NZD gains some upside momentum but still bearish
  JPY Pairs Action Bias: EURJPY Leads as Bullish Standout Amid Mixed Momentum
  FxWirePro : GBP/NZD strongly bearish despite upside attempts
  FxWirePro: GBP/AUD gains above 1.9200 level , upside pressure builds
  FxWirePro- Major Crypto levels and bias summary
  FxWirePro- Woodies pivot (Major)
  FxWirePro: GBP/NZD maintains bersish bias with focus on 2.2900 level
  FxWirePro: USD/CAD slips after Fed holds rates steady
  FxWirePro- Major Pair levels and bias summary


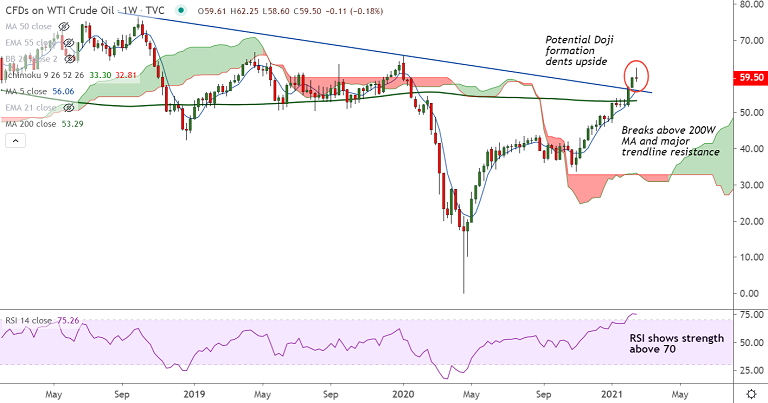
USOIL chart - Trading View
Technical Analysis: Bias Turning Bearish
- US Oil trades weaker for the second straight session
- Price action has slipped below 5-DMA, is on track to test 21-EMA at 57.13
- Stochs and RSI are on verge of rollback from overbought levels
- Potential Doji formation on the weekly charts dents upside
- 200H MA is offering support on the intraday charts, break below will drag prices lower
Support levels - 59.36 (200H MA), 57.13 (21-EMA), 56.07 (5W MA)
Resistance levels - 65.62 (Jan 2020 high), 66.58 (April 2019 high), 69.52 (200W MA)
Summary: US Oil slips lower on account of extreme overbought conditions. Downbeat inventory numbers to keep downside cushioned. As per the latest inventory data from the US Energy Information Administration (EIA), US Crude Oil Stocks dropped below -2.429M forecast to -7.258M for the week ended on February 12. Technical bias is still bullish. Bullish invalidation likely below 21-EMA.


