


 FxWirePro- Major Pair levels and bias summary
  GBPJPY Surges to 211.88: Sterling Bulls Target 215 Amid Broad-Based Buying
  FxWirePro: EUR/ NZD consolidating around 2.0200, room for further gains
  Bitcoin's Tug-of-War: Bulls Eye 80,000 USD Despite Turbulent ETF Outflows
  FxWirePro: GBP/USD stuck in range but maintains bearish bias
  Ethereum Braces for Volatility: Technicals Turn Bearish as Geopolitical Tensions Loom
  FxWirePro- Major Crypto levels and bias summary
  FxWirePro: EUR/AUD falls below 1.6600 level, plunge to test a key fibo grows
  EUR/JPY Breaks Out: Euro Surges Past 185.00 Resistance Amid Strong Bullish Momentum
  FxWirePro- Major Crypto levels and bias summary
  FxWirePro: NZD/USD neutral in the near-term, scope for downward resumption
  FxWirePro- Major European Indices
  FxWirePro- Major Pair levels and bias summary
  FxWirePro: EUR/AUD eases as market awaits Iran deadline
  FxWirePro: USD/CNY drifts lower, vulnerable to more downside
  Ethereum Joins the Rally: ETH Reclaims USD 2,100 Following Bitcoin's Lead


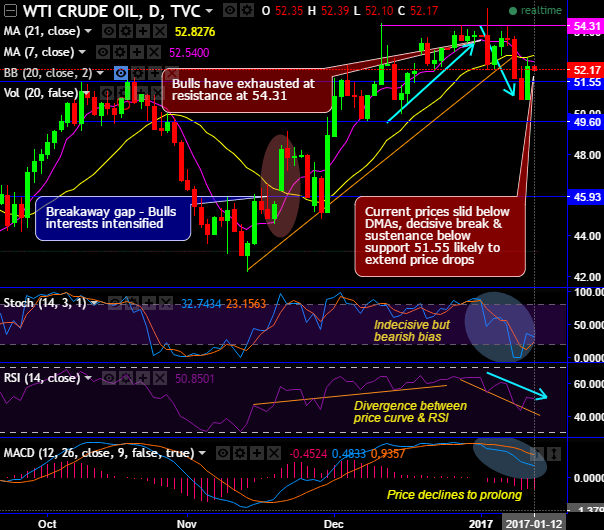
Bulls seem to have exhausted at resistance at 54.31 levels, more price dips seems to be on cards as the current prices slid below DMAs, decisive break & sustenance below support 51.55 likely to extend price drops.
You could very well observe the divergence between price curve & RSI, as a result we foresee downswings may extend to retest support at around 49.60 levels. The other leading oscillator (stochastic) has been indecisive but bearish bias.
MACD on the other hand also indicates price drops likely to drag further.
On the contrary, as stated in our previous post we’ve been still firm on bullish targets in the medium run, WTI crude price has been spiking higher through ascending triangle (monthly chart) showing strength in rallies after the formation of breakaway and runaway gap patterns that’s been traced out on daily plotting.
The current prices of WTI crude are well EMAs on this timeframe but restrained below resistance of ascending triangle, for now, the price band has been stuck in the range of $50 and $54.50 levels, the break above 55.21 levels to evidence more bullish environment towards $60 levels. But we reiterate at this juncture, it seems like this make or break scene for WTI crude? The uptrend stuck in triangle resistance & support.
RSI evidences the upward convergence to the price spikes. While stochastic curves have been indecisive but bullish bias.
To substantiate this bullish stance, weekly MACD signals upswings to extend further.
Hence, we don’t encourage long-term short build ups hereafter; instead, we encourage longs in WTI crude of mid-month expiries for targets of 55 or even 60 levels with strict stop loss of 49.50 levels, thereby, the trade carries attractive risk reward ratio.


