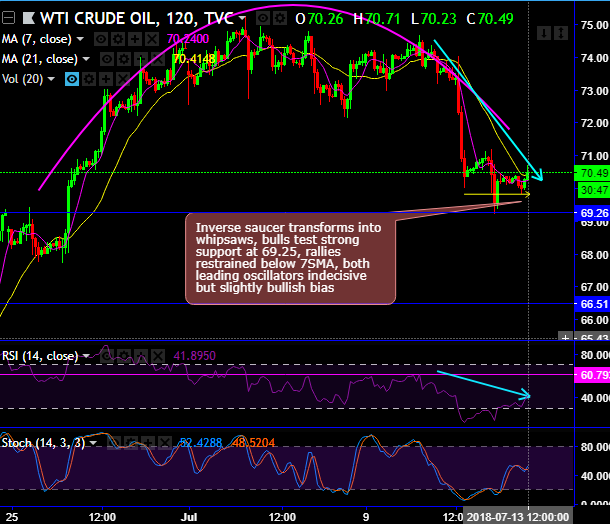
WTI price bounces back from the lows of $69.81 levels, it was dropped noticeably on Wednesday despite the EIA reported a more than 12 mbpd draw in US crude oil supplies
Technically, WTI crude price has formed inverse saucer that was transformed into whipsaws, bulls test strong support at 69.25, rallies restrained below 7SMA, both leading oscillators indecisive but slightly bullish bias (daily chart).
On a broader perspective, the consolidation phase of this energy commodity has broken symmetric triangle resistance, but the trend, for now, seems edgy at 50% Fibonacci levels (refer monthly plotting). While the bears resume on shooting star formation, both leading oscillators signal the overbought pressures on this timeframe.
The Organization of the Petroleum Exporting Countries and its Russia-led allies agreed on late June to boost their output to replace a fall in production such in Venezuela and Iran, as per WSJ reports.
Crude oil fundamentals are expected to weaken in 2019 on the back of stronger than expected non-OPEC supply but also the potential release of barrels from OPEC as the joint accord between OPEC and non-OPEC is unlikely to stay in place given the changes in OPEC dynamics lately.
The deep under-valuation of crude oil vols relative to demand and supply drivers has corrected to a large extent. A meaningful change from 1H to 2H’2018 could be that upside risks to prices and vol from a disruptive spike may moderate if OPEC carefully smoothens production and additional shale supply comes to the market. Crude risk-reversals nonetheless discount an overly fat left tail due to ongoing producer hedging that is ripe for continued selling for alpha generation.
Hence, contemplating the above factors, on hedging rounds we advocate longs in NYME crude contracts for September delivery with a view of arresting further bullish risks.


 Wall Street Analysts Weigh in on Latest NFP Data
  UBS Predicts Potential Fed Rate Cut Amid Strong US Economic Data
  Lithium Market Poised for Recovery Amid Supply Cuts and Rising Demand
  U.S. Banks Report Strong Q4 Profits Amid Investment Banking Surge
  Gold Prices Slide as Rate Cut Prospects Diminish; Copper Gains on China Stimulus Hopes
  2025 Market Outlook: Key January Events to Watch
  Moody's Upgrades Argentina's Credit Rating Amid Economic Reforms
  Goldman Predicts 50% Odds of 10% U.S. Tariff on Copper by Q1 Close
  US Gas Market Poised for Supercycle: Bernstein Analysts
  Mexico's Undervalued Equity Market Offers Long-Term Investment Potential
  European Stocks Rally on Chinese Growth and Mining Merger Speculation


