


 Ethereum Cracks Under $1,700: Sell the Rally Near $1,750 as Bears Eye $1,380–$1,200
  FxWirePro: USD/ CNY falls towards 6.750, bears keep the advantage
  FxWirePro: GBP/AUD runs out of steam but maintains bullish outlook
  FxWirePro: AUD/ USD strongly bearish despite upside attempts
  FxWirePro: USD/JPY gains above 160 level ahead of BOJ policy meeting
  FxWirePro: EUR/AUD loses upside momentum but outlook is bullish
  FxWirePro- Woodies pivot (Major)
  BTC’s Bear Bounce: Sell the Rally Near $66K as Bears Target $59K–$52K Breakdown
  FxWirePro: AUD/USD climbs as US-Iran peace deal sparks risk rally
  FxWirePro: NZD/USD jumps after US and Iran agree preliminary deal
  FxWirePro: USD/CAD steadies around 1.3990 ,retains bid one
  Peace Dividend Powers NZDJPY Past 93.50 — Bulls Set Sights on 96.15 Target


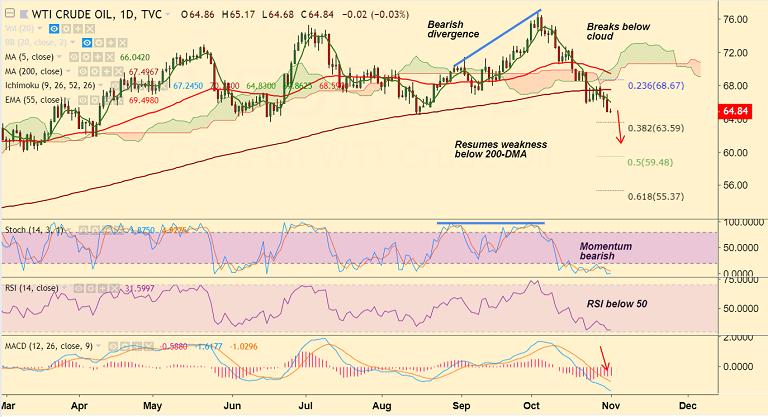
US oil chart on Trading View used for analysis
- US oil is trading in an extremely narrow range, capped below $65 per barrel mark.
- Rising US crude supplies combined with global growth concerns continue to undermine the sentiment.
- Markets remain wary about the global economic slowdown fears amid ongoing US-China trade war and the European political woes.
- Further, the US EIA data showed that the US crude oil inventories climbed for a sixth straight week.
- The pair is extending break below 200-DMA and now targets next major support at 38.2% Fib at 64.94.
- Technical studies support weakness, momentum studies are bearish. Break below 38.2% Fib to extend weakness.
Support levels - 63.59 (38.2% Fib), 61.84 (Apr 6 low)
Resistance levels - 66.07 (5-DMA), 67.49 (200-DMA)
For details on FxWirePro's Currency Strength Index, visit http://www.fxwirepro.com/currencyindex.


