


 How Donald Trump has changed the way diplomacy is done
  Sell the Bounce": Gold Rally Stalls Near $4165 as Fed Hawks Slam the Door on Rate Cuts — Targets $4000/$3600
  Gold's 365-Day EMA Streak Since Oct 2023 Faces Its First Real Test at $3,980 — Break or Bounce to $4,140?
  Morgan Stanley Sees Chinese Auto Market Recovery Gaining Momentum in Late Summer
  Gold Surges Above Key EMAs, Bulls Eye Resistance Amidst Bullish Momentum
  AI Memory Boom Sparks Global Chip Supply Crunch
  Silver Cracks Key 365-Day EMA for First Time Since Feb 2024; Bears Eye $50 on Rallies
  Goldman Sachs: US Dollar Likely to Stay Strong Despite Oil Price Retreat
  How AI prompting turned writerly description into an everyday skill
  Today’s space race could turn fatal if we don’t agree on new rules


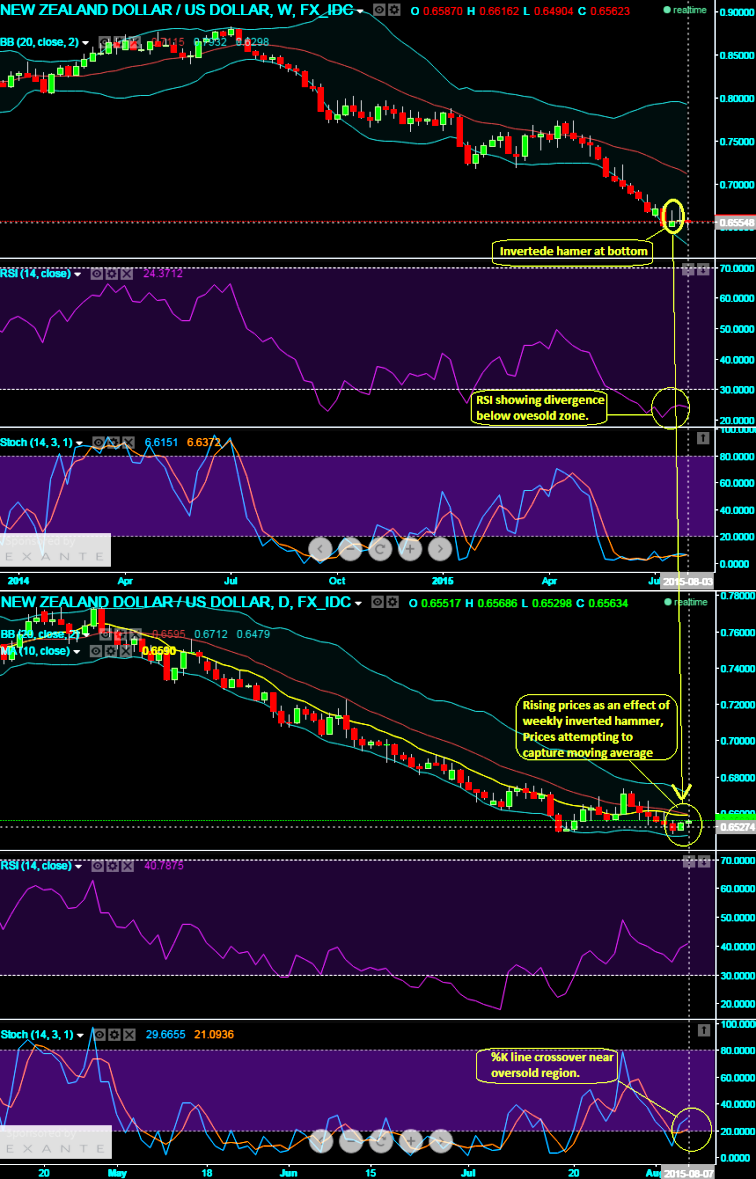
Technical glimpse:
The inverted hammer that was spotted out in our earlier call has factored in the daily prices (see what has happened on daily chart after the formation inverted hammer). The pair was able to hold 6 years lows of NZD/USD as inverted hammer pattern candle that was occurred on weekly chart exactly at 0.6572.
- RSI justifies rising prices: The pair at this psychological juncture testing supports as 14 weeks RSI shows positive convergence with spiking prices as it crossed below 30 levels which is oversold zone.
- Stochastic supports momentum: To substantiate this view on weekly charts slow stochastic curves were attempting to remain in sync with standpoint offered by RSI. Currently, RSI (14) is trending at 24.4127 and %K line crossover below 20 signifies a certain short term price recoveries if not long term bull sentiments.
- 10DMA: As we all know moving average is a lagging indicator, the moving average of ten day time frame was also suggesting the prevailing daily prices are attempting to follow uptrend that has created during last few intraday rallies.
- Trading tips: We look ahead for some minor dips in order for snatching the ideal entry points for the target at 0.6575 levels. The trade idea would be good to buy ATM binary calls at every dips for targets of 15-20 pips.


