


 FxWirePro: USD/ZAR continues to recovers , upside pressure builds
  EUR/JPY Breaks Out: Euro Surges Past 185.00 Resistance Amid Strong Bullish Momentum
  FxWirePro: EUR/AUD falls below 1.6600 level, plunge to test a key fibo grows
  FxWirePro: GBP/NZD reverses course, bias back to downside
  FxWirePro: USD/CNY drifts lower, vulnerable to more downside
  FxWirePro- Major European Indices
  Aussie Ascent: AUDJPY Charges Toward 112 as Bullish Momentum Hits Five-Day High
  Ethereum Braces for Volatility: Technicals Turn Bearish as Geopolitical Tensions Loom
  FxWirePro: EUR/ NZD consolidating around 2.0200, room for further gains
  FxWirePro- Major Pair levels and bias summary
  FxWirePro: EUR/ NZD downside pressure builds, key support level in focus
  FxWirePro- Major European Indices
  FxWirePro: NZD/USD neutral in the near-term, scope for downward resumption
  NZDJPY Bearish Breakdown: Why Selling the Rallies is the Strategic Play
  FxWirePro- Major Pair levels and bias summary


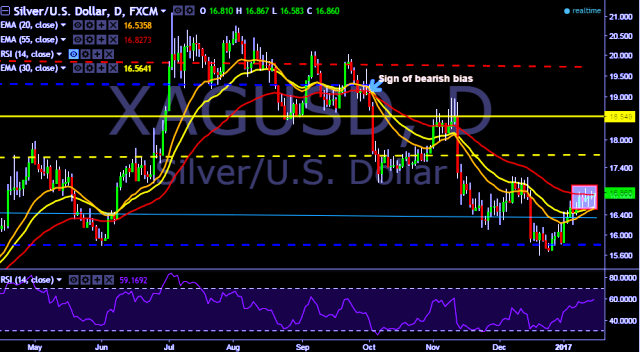
- XAG/USD is currently trading around $16.85 marks.
- It made intraday high at $16.86 and low at $16.58 levels.
- Intraday bias remains neutral for the moment.
- A daily close above $16.82 will test key resistances at $16.92/$16.99/$17.08/$17.26 marks respectively.
- On the other side, a daily close below $16.82 will take the parity down towards key supports at $16.57/$16.37/$16.20/$16.05/$15.95/$15.86/$15.74/$15.66/$15.54/$15.32/$15.01 marks respectively.
- Important to note here that 20D, 30D and 55D EMA heads down and confirms the bearish trend in a daily chart. Current upside movement is short term trend correction only.
We prefer to go long on XAG/USD around $16.82 with stop loss at $16.72 and target of $16.99.


