


 FxWirePro: AUD/USD spikes as Trump announces two-week Iran ceasefire
  Ethereum Reclaims Higher Ground: Ether Bulls Target $2,700 as Middle East Tensions Thaw
  Ethereum Braces for Volatility: Technicals Turn Bearish as Geopolitical Tensions Loom
  FxWirePro: GBP/USD climbs to 4 -week high as ceasefire deal gives bulls traction
  Euro Ascendant: EUR/USD Breaks $1.17 as Geopolitical Relief Sparks a Bullish Surge
  FxWirePro: USD/ZAR slips sharply lower as US-Iran ceasefire lifts risk appetite
  FxWirePro: USD/ JPY slips as yen rallies after Mideast ceasefire declaration
  FxWirePro: GBP/USD stuck in range but maintains bearish bias
  Aussie Bulls Charge: AUD/JPY Rallies as Geopolitical Clouds Part
  Pound Sterling Power: GBP/JPY Secures Third Day of Gains as Global Risk Tensions Recede
  FxWirePro: USD/CNY falls to three-year high, scope for further downside
  Aussie Ascent: AUDJPY Charges Toward 112 as Bullish Momentum Hits Five-Day High
  FxWirePro- Major European Indices
  FxWirePro: GBP/AUD downtrend extends, eyes 1.8900 evel
  EUR/JPY Breaks Out: Euro Surges Past 185.00 Resistance Amid Strong Bullish Momentum
  Bitcoin Breaks the $70,000 Barrier: Bulls Target the $80,000 Horizon as Geopolitical Relief Ignites Crypto Markets
  FxWirePro: USD/ZAR continues to recovers , upside pressure builds


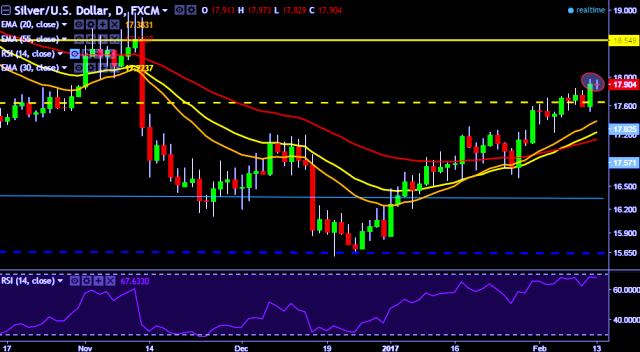
- XAG/USD is currently trading around $17.90 marks.
- It made intraday high at $17.97 and low at $17.82 levels.
- Intraday bias remains neutral till the time pair holds key resistance at $17.98 mark.
- A daily close above $17.97 will test key resistances at $18.12/$18.26/$18.47 marks respectively.
- On the other side, a daily close below $17.91 will take the parity down towards key supports at $17.68/$17.51/$17.44/$17.38/$17.22/$17.06/$16.99/$16.85/$16.70 marks respectively.
- Important to note here that 20D, 30D and 55D EMA heads up and confirms the bullish trend in a daily chart. Current downside movement is short term trend correction only.
We prefer to go long on XAG/USD around $17.86 with stop loss at $17.75 and target of $17.98/$18.12.


