Home / Technicals / Article Technicals
Add as a preferred source on Google FxWirePro: XAG/USD hovers around $14.10 mark, downside limited XAG/USD is currently trading around $14.10 marks. It made intraday high at $14.20 and low at $14.05 levels. Intraday bias remains neutral for the moment. A daily close above $14.13 will test key resistances at $14.28, $1…
By FxWirePro Team Sep 7, 2018, 8:18 AM UTC
Image from the original EconoTimes article Read the original article
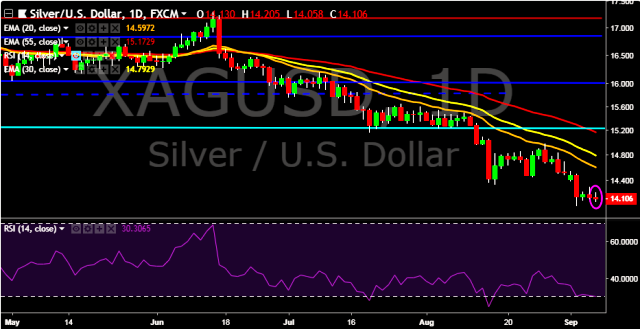
XAG/USD is currently trading around $14.10 marks.
It made intraday high at $14.20 and low at $14.05 levels.
Intraday bias remains neutral for the moment.
A daily close above $14.13 will test key resistances at $14.28, $14.47, $14.70, $14.98, $15.10, $15.32 and $15.47 marks respectively.
On the other side, a daily close below $14.13 will take the parity down towards key supports at $13.99, $13.85, $13.68 and 13.51 marks respectively.
Important to note here that 20D, 30D and 55D EMA heads down and confirms the bearish trend in a daily chart.
We prefer to take long position on XAG/USD around $14.00, stop loss $13.85 and target of $14.47.
Technicals EURUSD - Levels to watch - 1.1100 GBPUSD Levels to watch - 1.3180 USDCHF Levels to watch - 0.8365 USDCAD - Levels to watch - 1.4300 AUDUSD - Levels to watch - 0.7000 NZDUSD - Levels to watch - 0.5560
By FxWirePro Team Oct 15, 2026, 3:20 AM UTC
Technicals EURUSD - Levels to watch - 1.100 GBPUSD Levels to watch - 1.3180 USDCHF Levels to watch - 0.8400 USDCAD - Levels to watch - 1.4300 AUDUSD - Levels to watch - 0.7000 NZDUSD - Levels to watch - 0.5560
By FxWirePro Team Oct 15, 2026, 3:17 AM UTC
Technicals JPY Major Pair Currency Score: USDJPY, GBPJPY and AUDJPY Extremely Bearish
By FxWirePro Team Oct 15, 2026, 2:34 AM UTC