


 FxWirePro- Woodies pivot (Major)
  Relief Rally Extends to 112.75, but AUDJPY EMA Structure Favors Selling
  BTC’s Bear Bounce: Sell the Rally Near $66K as Bears Target $59K–$52K Breakdown
  FxWirePro: USD/JPY gains above 160 level ahead of BOJ policy meeting
  FxWirePro- Woodies pivot (Major)
  FxWirePro: AUD/USD climbs as US-Iran peace deal sparks risk rally
  FxWirePro: USD/ CNY falls towards 6.750, bears keep the advantage
  FxWirePro: USD/ZAR edges higher, set to stay on back foot
  FxWirePro: NZD/USD jumps after US and Iran agree preliminary deal
  FxWirePro: GBP/NZD stuck in range but outlook is bullish
  FxWirePro: GBP/AUD eases on Geopolitical whipsaw
  FxWirePro: USD/CAD steadies around 1.3990 ,retains bid one
  FxWirePro: GBP/USD range-bound as Iran uncertainty keeps traders cautious


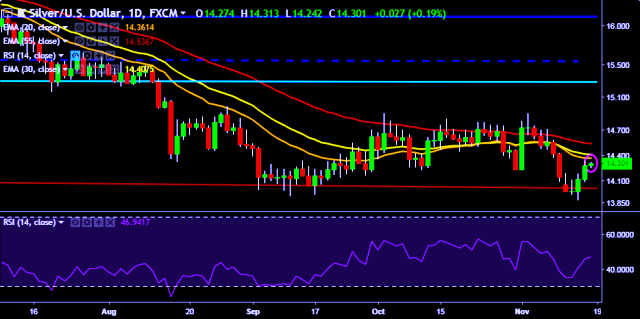
- XAG/USD is currently trading around $14.29 marks.
- It made intraday high at $14.31 and low at $14.24 levels.
- Intraday bias remains neutral till the time pair holds key resistance at $14.32 mark.
- A daily close above $14.27 will test key resistances at $14.40, $14.57, $14.72, $14.78, $14.82, $14.98, $15.10, $15.32 and $15.47 marks respectively.
- On the other side, a daily close below $14.27 will take the parity down towards key supports at $14.07, $13.90, $13.82, $13.68 and 13.51 marks respectively.
- Important to note here that 20D, 30D and 55D EMA heads down and confirms the bearish trend in a daily chart. Current upside movement is short term trend correction only.
We prefer to take long position on XAG/USD only above $14.32, stop loss $14.20 and target of $14.57.


