
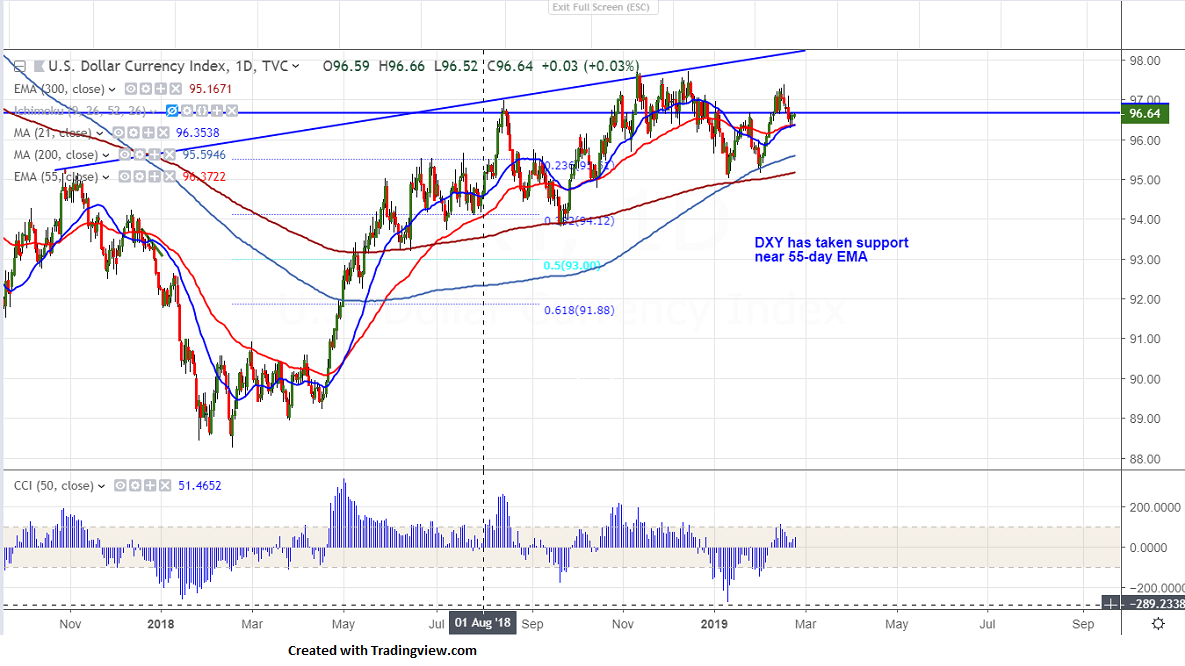
DXY is trading flat after hitting low of 96.29 on Feb 20th 2019. The index jumped till 96.66 and is hovering around that level. The index has taken support after showing a minor decline below 50- day MA. It is currently trading around 96.64.
On the lower side, near term major support is around 96.31 (50-day MA) and any break below will drag the index down till 96/95.57 (200- day MA). The index should break below 95.16 (300-day EMA) for further weakness.
The near term resistance is around 96.71 (38.2% fib) and any break above will take the DXY to next level 97/97.37 (Feb 15th 2019 high). Any break above 97.71 confirms further bullish continuation.
It is good to sell on rallies around 96.75-80 with SL around 97.20 for the TP of 95.60.
Resistance
R1- 96.75
R2 -97.20
R3-97.37
Support
S1- 96.30
S2- 95.95
S3- 95.57


