


 Bitcoin’s Islamabad Watch: BTCUSD Consolidates Near 71,421 USD as Geopolitical Peace Talks Loom
  FxWirePro: AUD/USD edged lower as early optimism over U.S.–Iran peace talks fade
  FxWirePro:NZD/USD continues to recovers , upside pressure builds
  FxWirePro- Major Pair levels and bias summary
  FxWirePro -Major European Indices
  Pound Sterling Power: GBP/JPY Secures Third Day of Gains as Global Risk Tensions Recede
  Ethereum Reclaims Higher Ground: Ether Bulls Target $2,700 as Middle East Tensions Thaw
  FxWirePro: GBP/USD bulls remain cautiously optimistic
  FxWirePro: USD/ZAR slips sharply lower as US-Iran ceasefire lifts risk appetite
  FxWirePro: GBP/USD climbs to 4 -week high as ceasefire deal gives bulls traction
  Euro Holds the Line: EURUSD Finds Support at the 365-EMA as Peace Talks Loom
  FxWirePro- Major Crypto levels and bias summary
  FxWirePro: EUR/AUD claws back some losses but rcovery likely muted
  FxWirePro- Major Crypto levels and bias summary
  Euro Ascendant: EUR/USD Breaks $1.17 as Geopolitical Relief Sparks a Bullish Surge


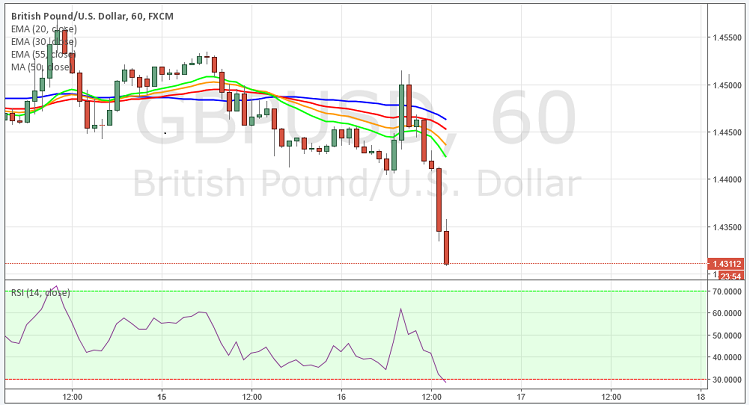
GBP/USD declined sharply on Tuesday as the greenback rose against sterling following soft UK inflation data. The GBP/USD pair made some healthy gains in early European session hitting as high as 1.4515 but the pair was weighted down by soft data and decline in European stocks.
- Currently the pair is trading around 1.4422 levels , it is set to decline further towards 1.4200 and later 1.4150 level.
- Technically in the 4 hour chart the 55, 30 and 20 MA depicts a clear bearish slope above the current price action, the RSI is indicating towards downside at 29.
- To the upside, the strong resistance can be seen at 1.4447, a break above this level would expose the cable to next resistance level at 1.4465 levels.
- To the downside strong support can be seen at 1.4309, a break below at this level will open the door towards next level at 1.4221.
Recommendation: Go short around 1.4340, targets 1.4260, 1.4180, SL 1.4470
Resistance Levels
R1: 1.4380 (50% Retracement level)
R2: 1.4447 (61.8 % Retracement level)
R3: 1.4465 (21 DMA)
Support Levels
S1: 1.4309 (38.2 % Retracement level)
S2: 1.4221 (23.6 % Retracement level)
S3: 1.4146 (Jan 29th lows)


