


 FxWirePro: GBP/NZD gains some ground but bias is still bearish
  GBPJPY Slips After Sterling Weakness, Bears Eye 216
  JPY Action Bias: USDJPY Emerges as the Clear Bullish Pair to Watch Amid Mixed Crosses
  FxWirePro- Woodies pivot (Major)
  FxWirePro: GBP/AUD downside pressure builds, key support level in focus
  FxWirePro- Major Pair levels and bias summary
  FxWirePro: EUR/NZD up trend gains momentum but hurdles ahead
  Major Pair Action Bias: Bullish Pairs to Watch Out For
  EUR/USD Bounces from Monthly Low, But Bearish Pressure Remains
  FxWirePro: USD/ZAR retreats but trend is still bullish
  FxWirePro: GBP/USD edges higher as traders await BoE guidance and UK fiscal clarity
  NZDJPY Pullback: Sell Rallies Toward 93.30 as Yen Weakness Eases
  AUDJPY Action Bias: Bullish Dip-Buy Setup Despite Flat Neutral Bias
  Major Pairs Action Bias: USDCAD and USDCHF Stand Out as Extremely Bullish While GBPUSD and NZDUSD Turn Extremely Bearish
  FxWirePro: USD/CAD gaining momentum for a move towards 1.4200 level


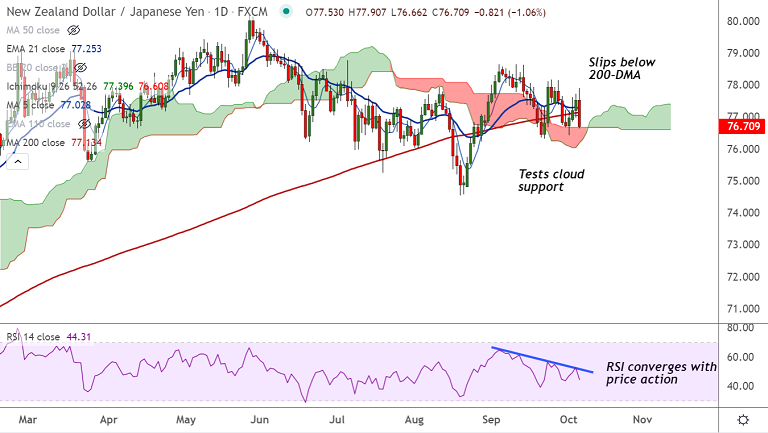
NZD/JPY chart - Trading View
Spot Analysis:
NZD/JPY slumped 1.11% and was trading at 76.68 at around 10:15 GMT
Previous Session's High/Low: 77.71/ 76.98
Previous Week's High/Low: 78.15/ 76.43
Fundamental Overview:
The Reserve Bank of New Zealand (RBNZ) matched wide market expectations with 25 basis points (bps) rate hike at its policy meeting early on Wednesday.
New Zealand's central bank hiked interest rates for the first time in seven years and signalled further tightening to come.
The 25 basis point rate hike marks the start of a tightening cycle as the central bank looks to get on top of inflationary pressures and cool a red-hot housing market.
Future moves depend on the medium-term outlook for inflation and employment. The central bank expects headline CPI inflation to increase above 4% in the near-term but return towards its 2% midpoint over the medium term.
Economists expect the benchmark rate to reach 1.50% by the end of next year and 1.75% by the end of 2023.
Technical Analysis:
- NZD/JPY erases most of the gains of the previous three session
- Price action has slipped below 200-DMA support
- The pair is testing support at daily cloud top, breach below will drag prices lower
- RSI converges with price action, momentum is bearish
- Volatility is high and GMMA indicator shows a bearish shift on the intraday charts
Major Support and Resistance:
Support levels - 76.66 (Cloud top), Resistance levels - 77.13 (200-DMA)
Summary: NZD/JPY bias neutral as long as pair holds cloud support. Breach below cloud will open downside. Failure to close below 200-DMA could negate any further bearish bias.


