


 FxWirePro- Major Pair levels and bias summary
  FxWirePro: GBP/USD rises as soft US data pressures dollar
  FxWirePro: USD/CAD retreats after Canada posts stronger-than-expected GDP growth
  Major FX Action Bias & US Market Sentiment: NZD/USD (Extremely Bullish) & AUD/USD (Bullish) Watchlist
  FxWirePro: GBP/NZD remains weak, eyes 38.2%fib support
  FxWirePro: AUD/USD gains some ground but outlook is bearish
  US Magnificent 7 Stocks Trend Score: Amazon & Microsoft Hit Extreme Bullish (+100) as Meta Drops to -100 — Key Resistance & Support Watchlist
  FxWirePro- Woodies pivot (Major)
  AUD/JPY Slips Below 112 as BOJ Intervention Sparks Bearish Momentum: Sell the Rallies
  FxWirePro- Major Crypto levels and bias summary
  NZDJPY Retreats on Yen Strength – Bearish Setup Targets 90 After Hitting 92.75 Low
  FxWirePro: USD/ZAR gains as stronger dollar outweighs upbeat South Africa's trade surplus
  FxWirePro- Woodies pivot (Major)
  FxWirePro: EUR/ AUD dips below 1.6400 level, focus on near term support
  Major European Indices Score Extremely Bullish: DAX Eyes 26000, CAC Targets 8600, FTSE100 at 11000 – Key Levels to Watch


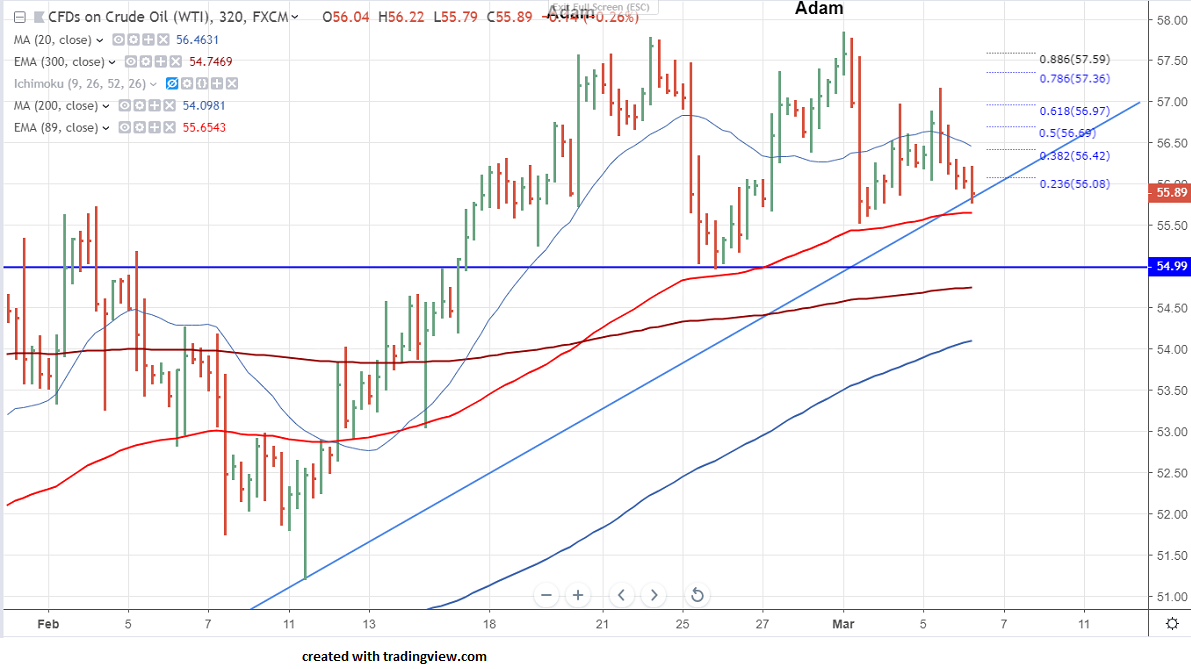
Chart pattern: Adam and Adam Double top pattern
US oil has formed almost a double top around $57.80 and shown a good selling from that level. It hits low of $55.55 and shown a minor recovery from that level. It is currently trading around $55.90.
The near term resistance is around $56.51 (20- 8H MA) and any break above will take the commodity to next level till $57/$57.17. Any violation above $57.17 will take the US oil to next level till $57.40/$57.85. Any bullish continuation only above $57.85.
On the lower side, near term major support is around $55 and any violation below will drag the commodity till$54.41/$53.77 (61.8% fib)/$53.13.
It is good to sell below $55 with SL around $55.51 for the TP of $53.15.


