


 FxWirePro- Woodies Pivot(Major)
  FxWirePro- Major Pair levels and bias summary
  FxWirePro- Major Crypto levels and bias summary
  NZDJPY Bears Take Control: New Zealand Dollar Retreats as 92 Resistance Holds Firm
  FxWirePro:NZD/USD drifts lower, could be on verge of bigger drop
  FxWirePro: USD/CNY gains some ground but bearish outlook persists
  FxWirePro: EUR/ NZD consolidating around 2.0180 room for further gains
  FxWirePro: AUD/USD downside pressure builds, key support level in focus
  FxWirePro: EUR/ NZD steadies around 2.0150, retains bid tone
  FxWirePro: USD/CAD runs out of steam but maintains bullish outlook
  FxWirePro: EUR/AUD gaining momentum for a move towards 1.6800 level
  Bitcoin Battles Volatility: Institutional Support Eyes USD 64,000 Floor Amid Geopolitical Tensions
  Ethereum Retreats Toward USD 2,000: Technicals Signal Caution as ETH Mimics Bitcoin’s Pullback
  FxWirePro: GBP/USD recovers but bears are not done yet again
  FxWirePro: USD/ZAR sustains gains as uptrend remains strong
  FxWirePro: GBP/NZD range to extend until there is game changing news


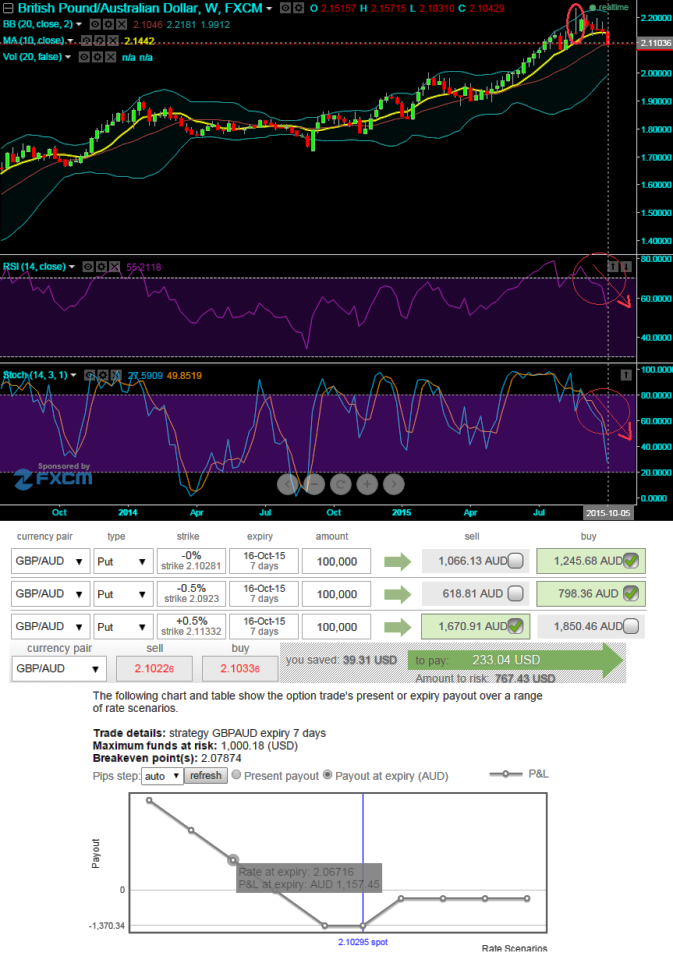
It is projected that the bearish gravestone doji patterns that were spotted out around 2.1552 levels on monthly charts as well as on weekly charts at around 2.1458 and again on 2.1586 levels have more downside potential. We interpret these bearish doji patterns at this juncture are an extremely helpful for traders visually to see where resistance and supply is likely located.
As a result we've been seeing corrections from tops of 2.2370 to 2.1023 level. We could now foresee the pair signals to traders that the uptrend could be over and that long positions should probably be exited when we compare this with other indicators and these indicators should have been studied in conjunction with the Gravestone Doji pattern to determine an actual sell signal. A potential trigger could be a break of the upward trendline support.
To substantiate this reversal stance, leading oscillators are also converging downwards with current falling price fluctuations. The daily current prices have shown their impact of this bearish candle pattern. The pair has fallen from the formation of 1st doji at 2.2370 up to 2.1373 levels.
RSI showing downward convergence on weekly is currently trending near 54.8631, while %D crossover on slow stochastic still maintains around 50 levels that signify bearish momentum is continuing. Daily prices are well below moving average curve.
We maintain our bearish stance on this pair as the current spot prices have been well below moving average curve that signals us long term bearish trend is on the cards. The pair has pretty much responded as per analysis and we could now foresee our target at 2.0855 levels towards south.
Currency hedging strategy: GBPAUD
With this technical reasoning, we recommend arresting further downside risks of this pair by hedging through Put Ratio back Spread instead of strips which involves extra cost.
So, purchase 1M 2 lots of At-The-Money -0.48 delta puts and sell 3D or 1w one lot of (1%) In-The-Money put option.
The short ITM puts funds to the purchase of the greater number of long puts and the position is entered for no cost or a net credit but the risk associated with this strategy is that there is a chance of exercising ITM shorts. The underlying exchange rate has to make substantial move on the downside for the gains in long puts to overcome the losses in the short puts as the maximum loss is at the long strike.

- News

- Economy

- Central Banks
- Investing
- Research
- Roundups
- Digital Currency
- Insights
- Technical Analysis
- Technology
- Business
- Law
- Health
- Nature
- Fintech
- Science
- Topic
- Opinions
- ©Econometrics LLC . All Rights Reserved.
FxWirepro: Risky traders can prefer GBP/AUD PRBS i/o strips to reduce cost - bears to extend further dips on doji formation
Friday, October 9, 2015 9:15 AM UTC
Editor's Picks


- Market Data
Most Popular


