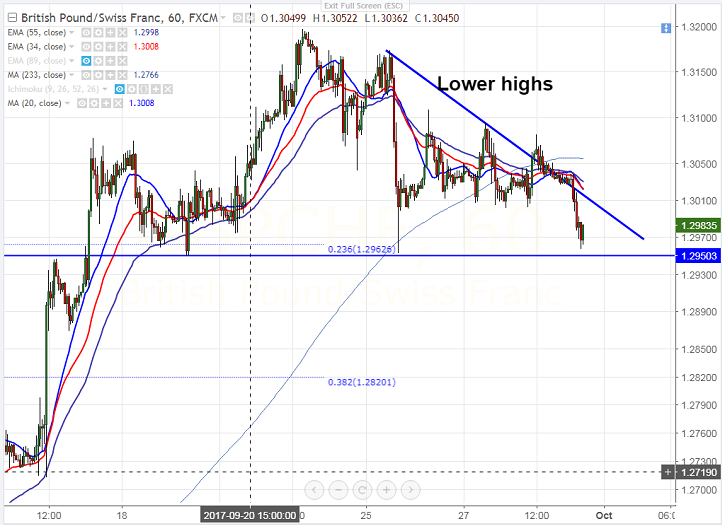
GBP/CHF forms descending triangle pattern, break below 1.29500 confirms further weakness
Chart pattern- Descending triangle pattern. Major support – 1.2950 GBP/CHF has recovered slightly after forming a bottom at 1.29528 on Sep 25th 2017. The pair jumped till 1.3108 and is currently trading around 1.29960. T…
GBP/CHF has recovered slightly after forming a bottom at 1.29528 on Sep 25th 2017. The pair jumped till 1.3108 and is currently trading around 1.29960.
The pair should break below 1.2950 for bearish continuation and any break below will drag the pair to next level till 1.2900/ 1.2820 (38.2% fibo).
On the higher side, near term resistance is around 1.3000 and any break above will take the pair to next level till 1.3030 (55- H EMA)/1.3055 (233- H MA).
It is good to sell below 1.2950 with SL around 1.3000 for the TP of 1.2825.