


 FxWirePro:EUR/NZD dips below lower range, bearish bias increases
  NZDJPY Bullish Surge: Strong Kiwi Ignites Fresh Upside as 94 Support Holds and All EMAs Align
  FxWirePro: AUD/ USD eases as risk sentiment remains fragile
  FxWirePro:EUR/NZD stuck In narrow ranges, focus on near term support
  FxWirePro: USD/ZAR advances as South African rand weakens amid renewed Middle East tensions
  Major Pair Action Bias: NZDUSD Turns Bullish While Other Majors Stay Neutral
  FxWirePro: USD/CAD falls after BoC rate hold and weak U.S. producer inflation
  FxWirePro: GBP/NZD downtrend loses steam, remains on bearish path
  FxWirePro: USD/JPY uptrend loses steam, remains on bullish path
  FxWirePro: USD/JPY holds steady near 162 as traders await fresh catalysts
  NZDJPY Bullish Setup: Buy Dips at 94.50 as Uptrend Holds Above All Key EMAs
  FxWirePro: NZD/USD trades in narrow range ,outlook bullish
  FxWirePro- Woodies pivot (Major)
  FxWirePro: GBP/NZD gains some upside momentum but still bearish
  Major Pair Action Bias: Extremely Bullish Surge Powers GBPUSD & NZDUSD as Bullish Momentum Ignites
  GBPJPY Bullish Surge: Strong Pound Ignites Fresh Upside on Fed-BOE Policy Divergence as All EMAs Align


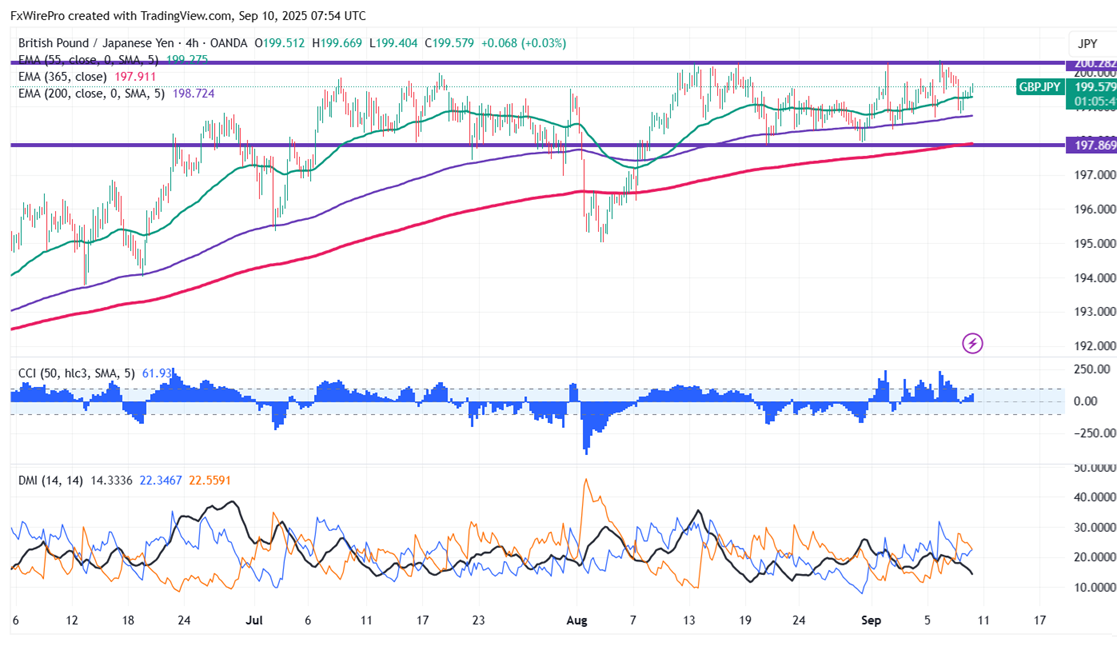
Forming a small bottom somewhat below 61.8% fib, GBPJPY displayed a little pullback. Intraday trend is bullish as long as support is 198.65. At present trading around 199.51, the pair hits an intraday high of 199.66.
The pair is trading above 55 and 200 EMA and 365 EMA (long-term) on the 4-hour chart, confirming a bullish trend. Any violation below 199.40 indicates the intraday trend is weak. A dip to 198.75 /198/197.85/197.25/ 196.70/196.20/195 is possible. Immediate resistance is at 200.35; a breach above this level targets of 202/203.
Market Indicators ( 4-hour chart)
CCI (50)- Bullish
Directional movement index - Neutral
Trading Strategy: Buy
It is good to buy on dips around 199.28-30 with SL around 198.60 for a TP of 202.


