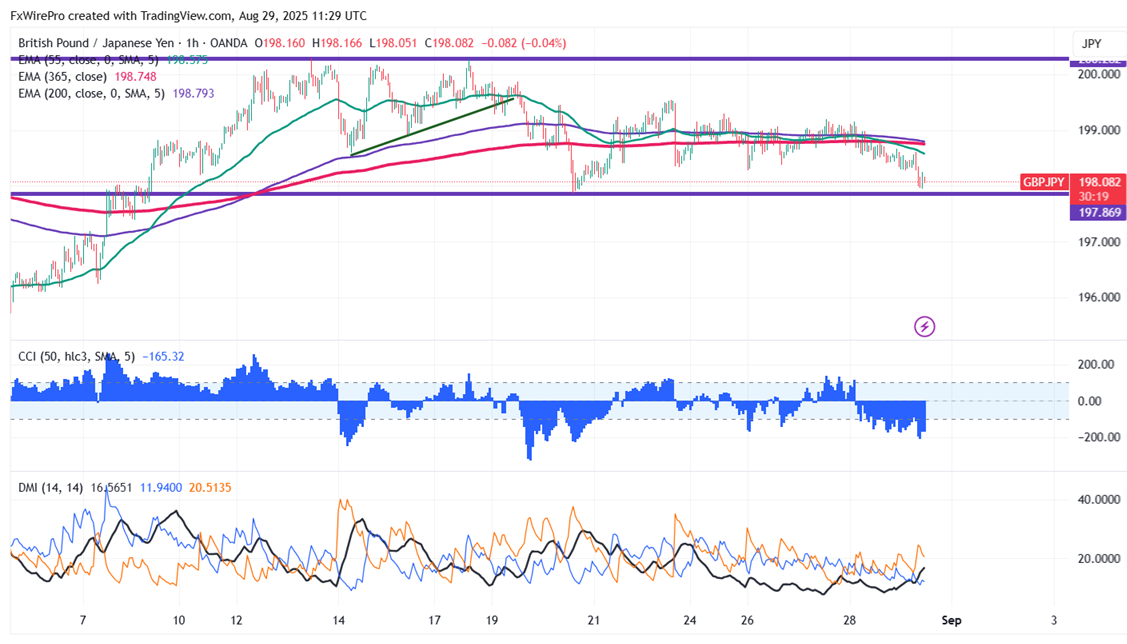
The GBP/JPY trades in a narrow range with a neutral bias. It hit an intraday low of 197.94 and is currently trading around 198.11. The intraday trend remains bearish as long as the resistance at 200 holds.
The pair is trading below the 55 and 200 EMA, as well as the 365 EMA (long-term), on the 1-hour chart, confirming a mixed trend. Any violation below 197.85 indicates the intraday trend is weak. A dip to 197.25/ 196.70/196.20/195 is possible. Immediate resistance is at 198.55 a breach above this level targets of 199/199.55/200/200.28/202.
Market Indicators ( 1-hour chart)
CCI (50)- Bearish
Directional movement index - Bearish
Trading Strategy: sell
It is good to sell on rallies around 198.78-80 with SL around 200 for a TP of 195



NZD/JPY Breakout Blast: Kiwi Rocket Smashes 94.50 Resistance, Bulls Lock Sights on 95
FxWirePro: USD/ZAR sell bias remains below key resistance zone
FxWirePro- Major Crypto levels and bias summary
FxWirePro: GBP/AUD downside pressure builds, key support level in focus
FxWirePro: USD/CAD slips as Canadian dollar firms on hopes for US-Iran ceasefire deal
FxWirePro: USD/CNY bears maintain upper hand
FxWirePro- Woodies pivot (Major)
FxWirePro: GBP/AUD downside pressure builds, key support level in focus
FxWirePro: GBP/USD edged higher as hopes for US-Iran deal boost riskier assets
FxWirePro- Major Pair levels and bias summary
Ethereum Tumbles Below $2K: Bears Eye $1,700 as All Key EMAs Flip Red
Bitcoin Bleeds $704M in ETF Outflows as Institutional Exodus Accelerates
FxWirePro: EUR/AUD downward momentum remains in place
FxWirePro: USD/CAD bulls continue to hold the higher ground
FxWirePro- Major Pair levels and bias summary 


