


 JPY Action Bias: Extremely Bullish Surge Ignites Across NZD, GBP & AUD
  FxWirePro: USD/ZAR advances as South African rand weakens amid renewed Middle East tensions
  FxWirePro- Major Pair levels and bias summary
  FxWirePro: GBP/NZD gains some upside momentum but still bearish
  FxWirePro:EUR/NZD dips below lower range, bearish bias increases
  Major Pair Action Bias: NZDUSD Turns Bullish While Other Majors Stay Neutral
  FxWirePro: EUR/AUD outlook weaker on renewed downside pressure
  FxWirePro: GBP/USD under pressure despite UK's modest economic growth
  FxWirePro- Major Crypto levels and bias summary
  FxWirePro: GBP/NZD downtrend loses steam, remains on bearish path
  JPY Action Bias: CADJPY Turns Extremely Bullish While Other Pairs Hold Positive Ground
  NZDJPY Bullish Surge: Strong Kiwi Ignites Fresh Upside as 94 Support Holds and All EMAs Align
  FxWirePro: NZD/USD trades in narrow range ,outlook bullish
  FxWirePro: EUR/AUD neutral in the near term, scope for downward resumption
  Major Pair Action Bias: Extremely Bullish Surge Powers GBPUSD & NZDUSD as Bullish Momentum Ignites


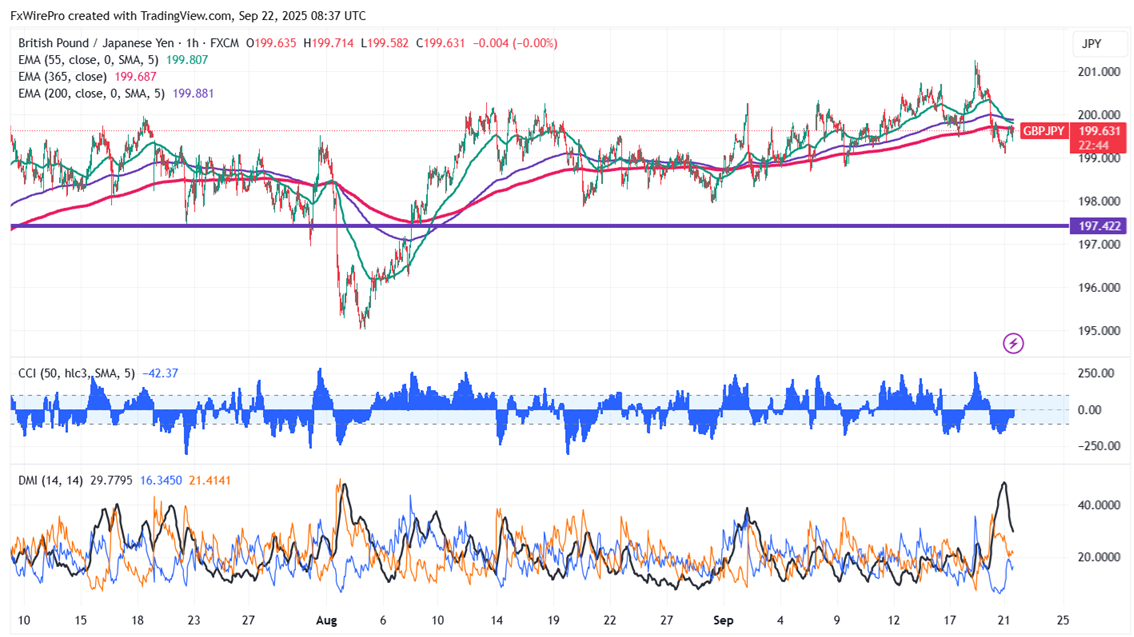
GBPJPY traded in a narrow range between 201.26 and 199.11 for the past three days. The intraday trend is bearish as long as the resistance at 200 holds. It is currently trading around 199.614; the pair reached an intraday high of 199.76.
The pair is trading below 55, 200 EMA, and 365 EMA (long-term) on the 1-hour chart, confirming a bearish trend. Any violation below 199 indicates the intraday trend is weak. A dip to 198.75 /198/197.85/197.25/ 196.70/196.20/195 is possible. Immediate resistance is at 200 a breach above this level targets of 200.53/201.26/ 202/203.
Market Indicators ( 1-hour chart)
CCI (50)- Bearish
Directional movement index - Neutral
Trading Strategy: Sell
It is good to sell on rallies 200 with SL around 201 for a TP of 197.25.


