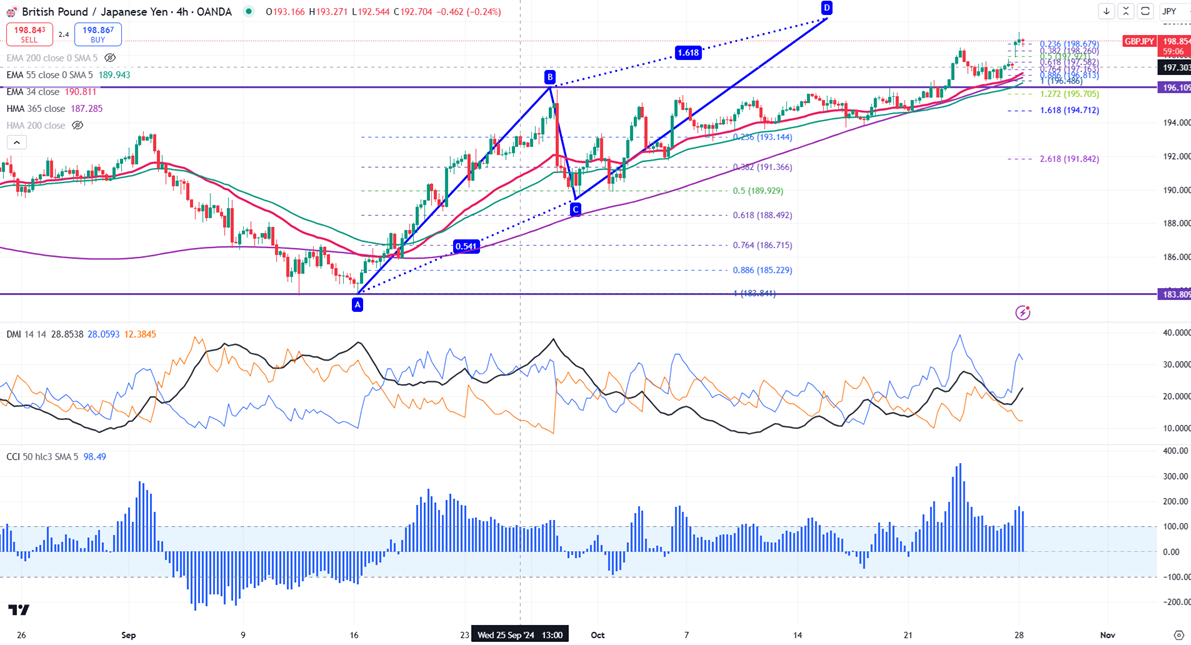
Summary of Bearish AB=CD Pattern for GBP/JPY
The GBP/JPY pair has seen a strong rise, reaching a high of 199.35 and currently trading around 198.85, mainly due to the weakening of the Yen caused by political uncertainties. The Potential Reversal Zone (PRZ) is identified at 200.20, and the pair has gained over 800 pips this month.
Technical Overview:
GBP/JPY is above short-term and long-term moving averages, indicating a bullish trend. Immediate resistance is at 199.35; if broken, it could rise toward 200.20.
Support is at 198, potentially dropping to 197.37, 196, or 195.40 if this level fails.
Indicator Analysis:
- CCI and ADX are both bullish, supporting an overall upward trend.
Trading Recommendation: Consider selling if the price approaches 200, with a stop loss of around 202 and aiming for a profit target of 196.


