


 FxWirePro: EUR/AUD outlook weaker on renewed downside pressure
  AUDJPY Bullish Surge: Strong Australian Dollar Fuels Fresh Upside as Pair Holds Above 113.50 and All EMAs Align
  NZDJPY Bullish Surge: Strong Kiwi Ignites Fresh Upside as 94 Support Holds and All EMAs Align
  FxWirePro: EUR/AUD neutral in the near term, scope for downward resumption
  FxWirePro: AUD/USD edges lower, but bullish outlook persists
  FxWirePro- Major Crypto levels and bias summary
  FxWirePro:EUR/NZD dips below lower range, bearish bias increases
  FxWirePro: GBP/NZD gains some upside momentum but still bearish
  FxWirePro: GBP/USD under pressure despite UK's modest economic growth
  FxWirePro: GBP/NZD downtrend loses steam, remains on bearish path
  GBPJPY Bullish Surge: Strong Pound Ignites Fresh Upside on Fed-BOE Policy Divergence as All EMAs Align
  FxWirePro: USD/CAD falls after BoC rate hold and weak U.S. producer inflation
  Gold Loses Steam After Strong U.S. Retail Sales
  JPY Action Bias: CADJPY Turns Extremely Bullish While Other Pairs Hold Positive Ground
  FxWirePro- Major Pair levels and bias summary
  FxWirePro: NZD/USD trades in narrow range ,outlook bullish


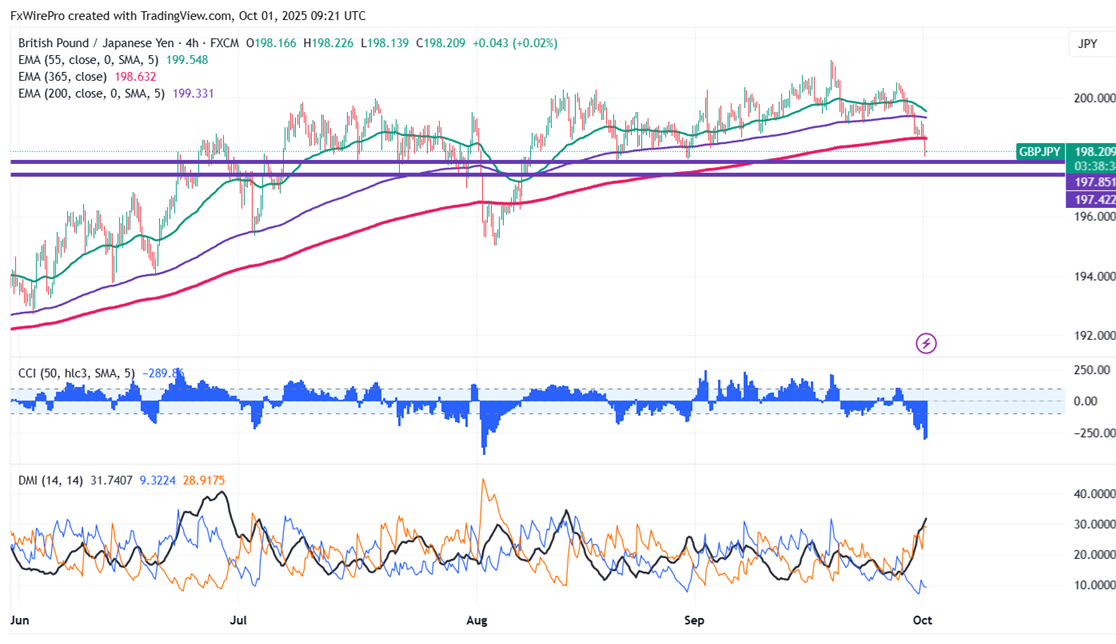
GBPJPY pared most of its gains on the strong yen. Presently trading around 198.19, the pair hit an intraday low of 198.01.
Oscillators and moving averages to forecast the trend of NDJPY
CMP- 198.15
EMA (4-hour chart)
55-EMA- 199.59
200-EMA- 199.34
365-EMA- 198.63. The pair trades below the short-term moving average and above the long-term moving average.
Previous week low- 199.11 (Sep 22nd low). The pair holds well below that level. Any breach below 198 will drag the pair down to 197.75/197.43/196.95.
Previous week high- 200.51 (Sep 25th high). Any break above 198.60 confirms minor bullishness; a jump to 199.20/199.60/2000 is possible.
Indicator (4-hour chart)
CCI (50)- Bearish
Average directional movement Index- Bearish. All indicators confirm a bearish trend.
It is good to sell on rallies around 198.48-50 with SL around 199 for TP of 197.


