


 FxWirePro: AUD/USD retreats slightly but trend is still bullish
  FxWirePro: USD/JPY holding bid into weekend
  FxWirePro- Woodies Pivot(Major)
  FxWirePro- Major Pair levels and bias summary
  FxWirePro: GBP/AUD gains some upside momentum but still bearish
  FxWirePro: GBP/NZD up trend gains some momentum but hurdles ahead
  FxWirePro: GBP/USD biased higher but rally currently stretched
  FxWirePro: GBP/AUD positions for another drop, eyes 1.8900level
  FxWirePro: USD/CNY neutral in the near-term, scope for downward resumption
  FxWirePro: GBP/USD bulls remain cautiously optimistic
  FxWirePro- Major Pair levels and bias summary
  FxWirePro: GBP/NZD down trend loses steam, remains on bearish path
  FxWirePro- Woodies Pivot(Major)
  FxWirePro: EUR/CAD gains ground on prospects of resumed energy flows
  FxWirePro: EUR/AUD downtrend loses steam but outlook still bearish


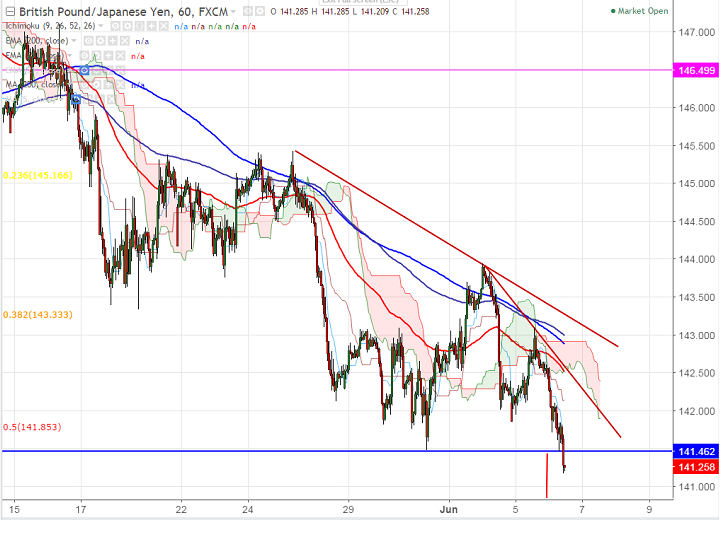
- GBP/JPY continues its losing streak after hitting high of 143.95 on Jun 2nd 2017. The pair broken temporary bottom around 141.48 on May 31st 2017. It is currently trading around 141.22.
- In the hourly chart the pair is trading well below Tenkan-Sen and Kijun-Sen and min or bullishness can be seen only above 142.28 (hourly Kijun-Sen). On the lower side, any break below temporary low confirms minor weakness, a decline till 140.37 (61.8% of 135.75 and 148.11)/138.50.
- The near term resistance is around 142.28 and any break above will take the pair till 143/143.95.
It is good to sell on rallies around 141.25-141.30 with SL around 142.05 for the TP of 140.37/139.


