Home / Technicals / Article Technicals
Add as a preferred source on Google GBP/NZD forms shooting star in daily chart, targets 2.0800 Candlestick pattern formed- Shooting Star Potential reversal Zone (PRZ) -2.1485 GBP/NZD recovered from the low of 2.1147 at the time of writing. It is currently trading around 2.1246. Short term trend is still weak as lo…
By FxWire Pro May 11, 2016, 7:32 AM UTC
Image from the original EconoTimes article Read the original article
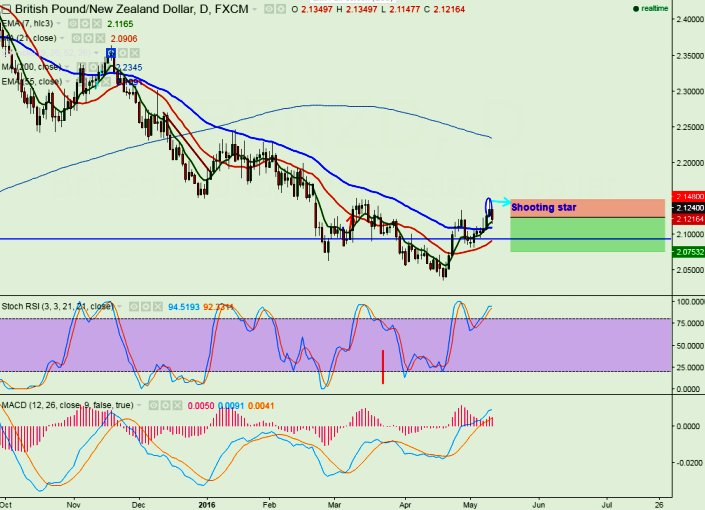
Candlestick pattern formed- Shooting Star
Potential reversal Zone (PRZ) -2.1485
GBP/NZD recovered from the low of 2.1147 at the time of writing. It is currently trading around 2.1246.
Short term trend is still weak as long as resistance 2.1485 holds.
On the lower side major support is around 2.109 (55 day EMA) and any break below targets 2.0940/2.0800.
Any break above 2.1485 will take the pair to next level till 2.165/2.16775 (161.8% retracement of 2.1345 and 2.0809).
It is good to sell on rallies around 2.12400-2.1450 with SL around 2.1485 for the TP of 2.0940/2.0800
Technicals EURUSD - Levels to watch - 1.1100 GBPUSD Levels to watch - 1.3180 USDCHF Levels to watch - 0.8365 USDCAD - Levels to watch - 1.4300 AUDUSD - Levels to watch - 0.7000 NZDUSD - Levels to watch - 0.5560
By FxWirePro Team Oct 15, 2026, 3:20 AM UTC
Technicals EURUSD - Levels to watch - 1.100 GBPUSD Levels to watch - 1.3180 USDCHF Levels to watch - 0.8400 USDCAD - Levels to watch - 1.4300 AUDUSD - Levels to watch - 0.7000 NZDUSD - Levels to watch - 0.5560
By FxWirePro Team Oct 15, 2026, 3:17 AM UTC
Technicals JPY Major Pair Currency Score: USDJPY, GBPJPY and AUDJPY Extremely Bearish
By FxWirePro Team Oct 15, 2026, 2:34 AM UTC